Confirming Optimize's Object Variable Flattening Cost With a Controlled A/B Test

In a previous Chaos Day and its variable-filtering follow-up, we measured Optimize's Elasticsearch overhead against Self-Managed load tests. Running the same kind of test against a Camunda SaaS cluster turned up something we didn't expect: Optimize's disk footprint there looks nothing like what we'd measured on Self-Managed. This Chaos Day traces that discovery to its root cause and confirms it through a controlled experiment.
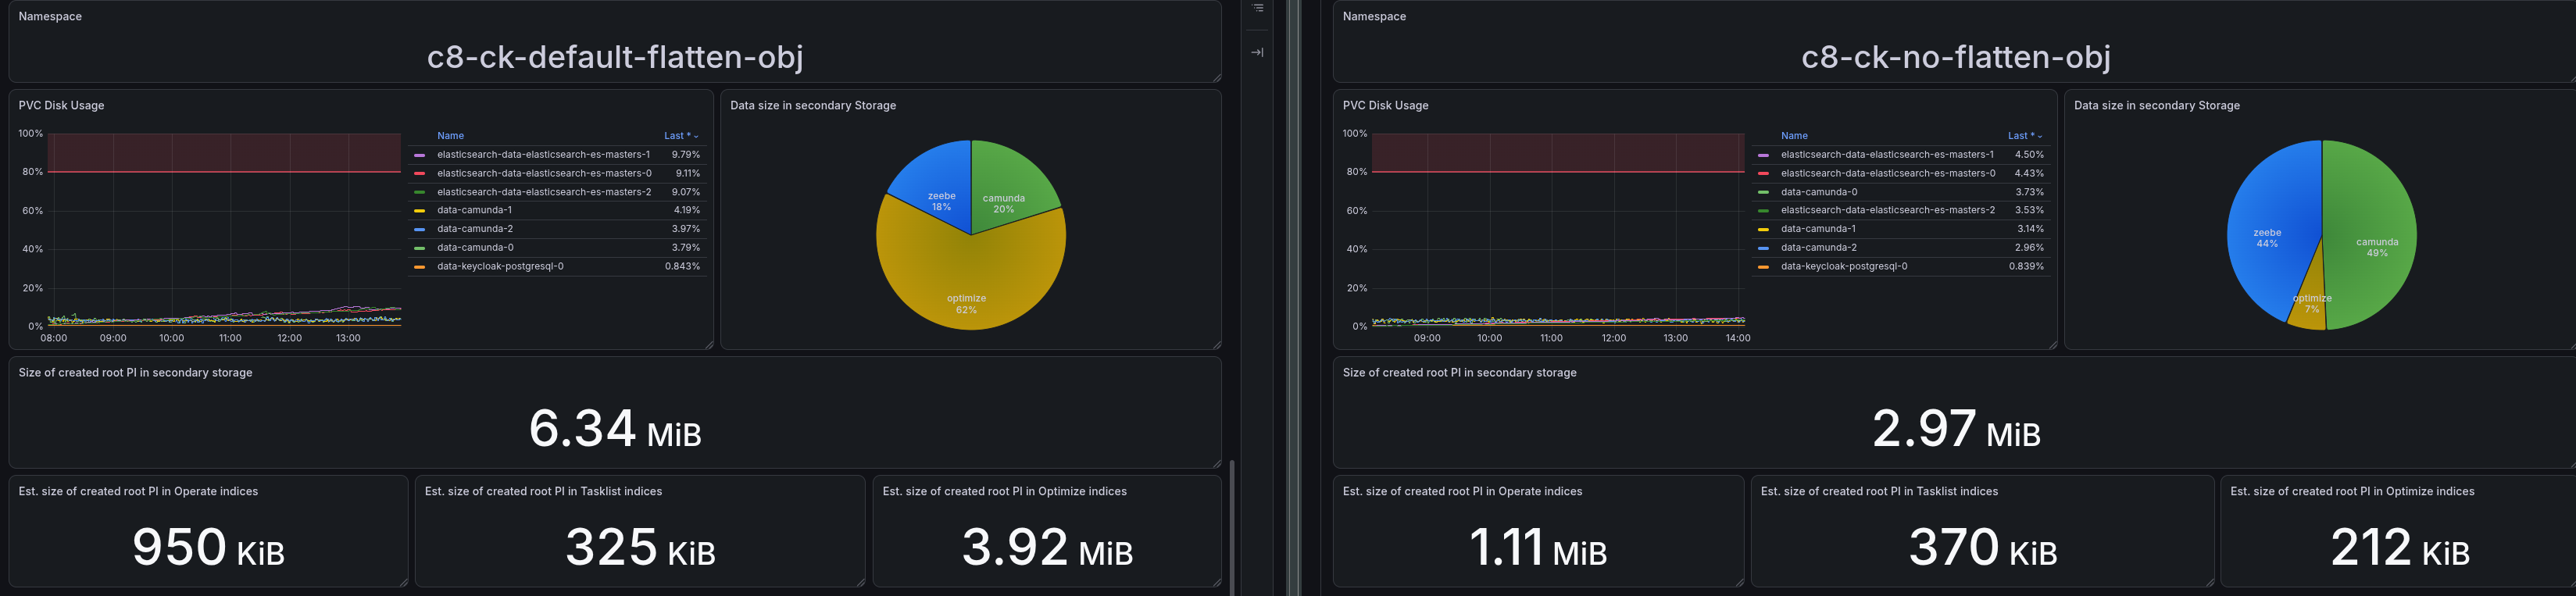
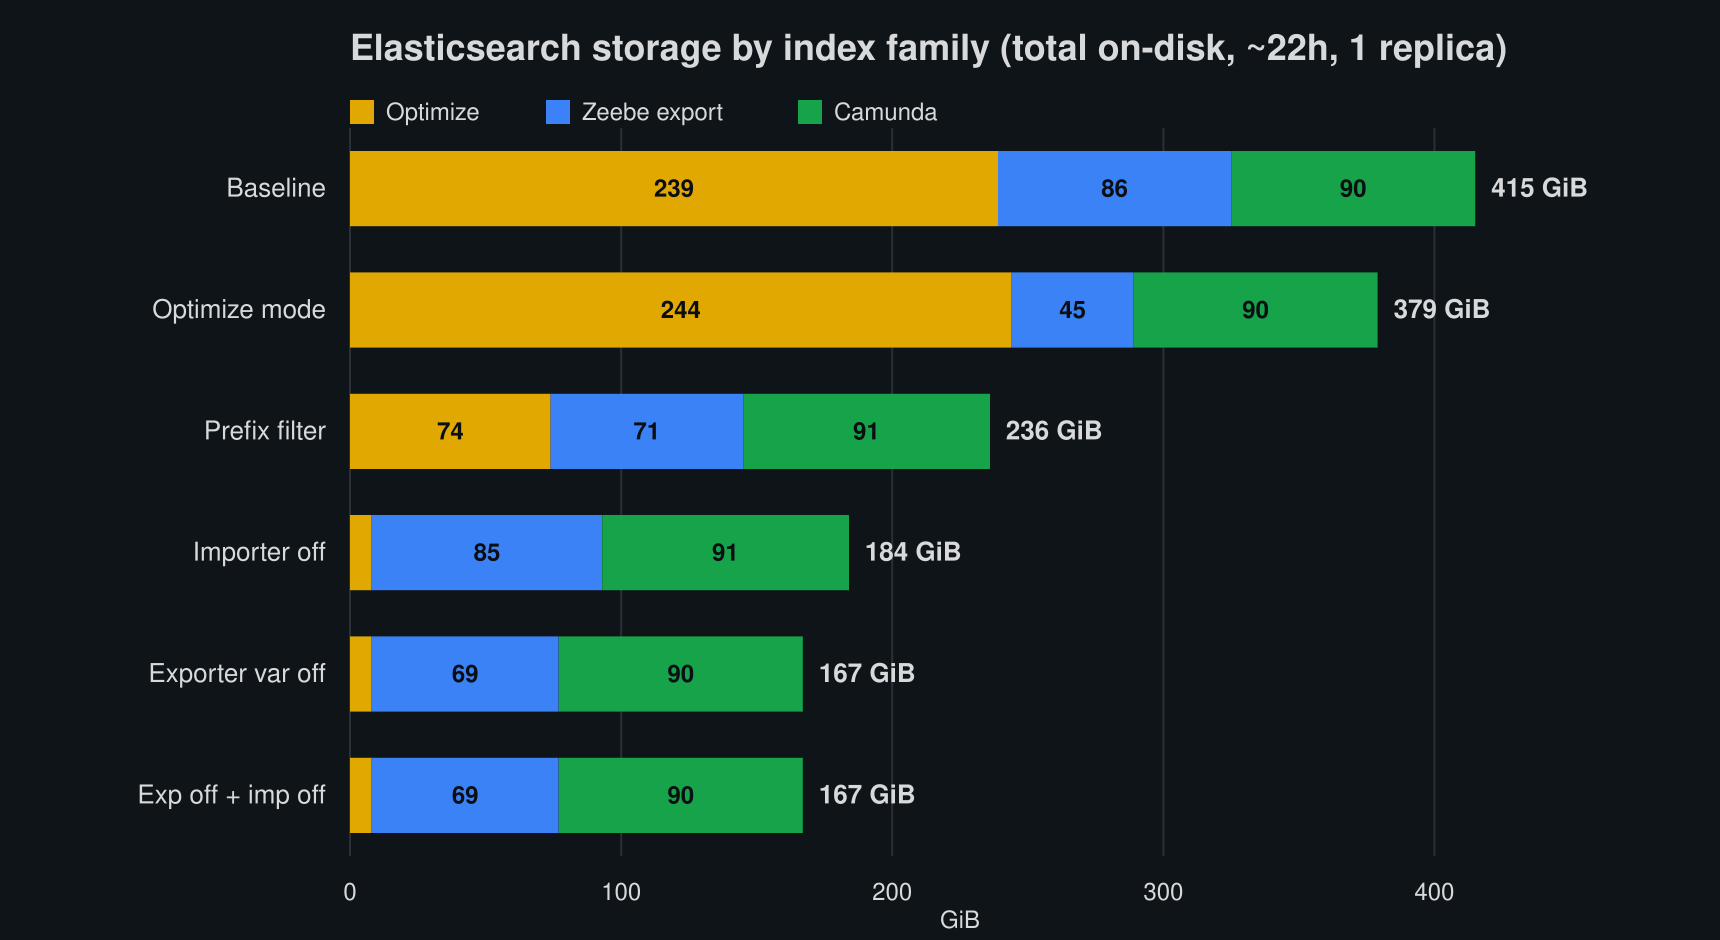
TL;DR; A week-long test against a SaaS Advanced 4x cluster showed Optimize's indices taking up only ~7-10% of total Elasticsearch disk, versus ~59-100% on our Self-Managed weekly load test running the exact same workload. The cause: Optimize's includeObjectVariableValue flag (env CAMUNDA_OPTIMIZE_ZEEBE_INCLUDE_OBJECT_VARIABLE) defaults to true and flattens every JSON object variable into one stored variable per property, plus the raw serialized object itself. Camunda SaaS explicitly disables this; the public Self-Managed Helm chart does not, so any Self-Managed deployment that hasn't touched this setting silently pays for it. We confirmed this with an isolated A/B test that changes only this one flag: Optimize's ES disk share dropped from 62.8% to 7.6%, an 8.3x reduction, for the same workload. The number that matters most for capacity planning: total secondary storage per root process instance dropped from 6.34 MB to 2.97 MB, a 2.13x reduction. This ratio is specific to our payload's shape: flattening recurses through nested JSON with no depth limit, so a payload with deeper nesting or more object fields can cost considerably more than this.