Elastic restart impact on Camunda

In today's Chaos Day, we explored the impact of Elasticsearch availability on Camunda 8.9+ (testing against main).
While we already tested last year the resiliency of our System against ES restarts (see previous post, we have run the OC cluster only. Additionally, certain configurations have been improved (default replica configurations, etc.).
This time, we wanted to see how the system behaves with OC + ES Exporter + Optimize enabled.
I was joined by Jon and Pranjal, the newest members of the reliability testing team.
TL;DR; While we found that short ES unavailability does not affect processing performance, depending on the configuration, it can affect data availability. For longer outages, this would then also impact Camunda processing. To mitigate this problem, corresponding exporters should be configured, but the necessary configurations are not properly exposed and need to be fixed in the Helm Chart.

Chaos Experiment
As mentioned earlier, we ran the complete Orchestration Cluster this time, with Optimize included and Authentication enabled (Keycloak, Identity).
For reference, the setup is documented here. In short, we ran the following components:
- Optimize deployment (importer,webapp)
- Keycloak
- Managed Identity
- PostgreSQL (for Identity and Keycloak)
- Camunda Cluster (3 Nodes)
- Elasticsearch Cluster (3 Nodes)
- Starter and Worker (load test deployment)
Expected
When restarting one Elasticsearch Node, we expected no impact on the Cluster, at least in terms of processing.
Actual
While starting up the cluster, we experienced a longer delay; it seems that Camunda applications are now more tightly coupled to ES (since 8.8). This means ES needs to be available, so Camunda can start the first time.
$ kgpo -w
NAME                                            READY   STATUS       RESTARTS      AGE
c8-chaos-full-test-connectors-c7bd56bdd-fj2lc   0/1     Running      0             101s
c8-chaos-full-test-identity-5f85fc588b-b7cxq    0/1     Running      0             101s
c8-chaos-full-test-keycloak-0                   1/1     Running      0             101s
c8-chaos-full-test-optimize-bc8f64d8b-9hghx     0/1     Init:Error   2 (21s ago)   28s
c8-chaos-full-test-optimize-bc8f64d8b-lwwnb     0/1     Init:Error   3 (57s ago)   101s
c8-chaos-full-test-postgresql-0                 1/1     Running      0             101s
camunda-0                                       0/1     Running      0             101s
camunda-1                                       0/1     Running      0             101s
camunda-2                                       0/1     Running      0             101s
elastic-0                                       0/1     Running      0             101s
elastic-1                                       0/1     Running      0             100s
elastic-2                                       0/1     Running      0             100s
prom-els-exporter-65484b6684-56hx2              1/1     Running      0             95s
starter-8458c4b895-wt2zf                        1/1     Running      0             98s
worker-c994df6c7-bbc9x                          1/1     Running      0             98s
worker-c994df6c7-jsddj                          1/1     Running      0             98s
worker-c994df6c7-wjmlv                          1/1     Running      0             98s
.....
.....     ES starts first
.....
elastic-0                                       1/1     Running      0             106s
elastic-1                                       1/1     Running      0             106s
c8-chaos-full-test-optimize-bc8f64d8b-9hghx     0/1     Init:CrashLoopBackOff   2 (12s ago)   37s
elastic-2                                       1/1     Running                 0             112s
c8-chaos-full-test-optimize-bc8f64d8b-9hghx     0/1     Init:0/1                3 (26s ago)   51s
c8-chaos-full-test-optimize-bc8f64d8b-9hghx     0/1     PodInitializing         0             58s
c8-chaos-full-test-optimize-bc8f64d8b-9hghx     0/1     Running                 0             59s
camunda-2                                       1/1     Running                 0             2m24s
camunda-1                                       1/1     Running                 0             2m25s
c8-chaos-full-test-identity-5f85fc588b-b7cxq    1/1     Running                 0             2m28s
camunda-0                                       1/1     Running                 0             2m31s
c8-chaos-full-test-connectors-c7bd56bdd-fj2lc   1/1     Running                 0             2m32s
Note:
This is something we might be able to improve in the future.
The reason is that we bootstrap the
SchemaManager(the component that is responsible for the ES/OS schema) and wait for its completion. This can only be completed when ES is up and running; the bootstrapping of additional components is delayed until the SchemaManager is complete.
After a short period of time, all the components came up.
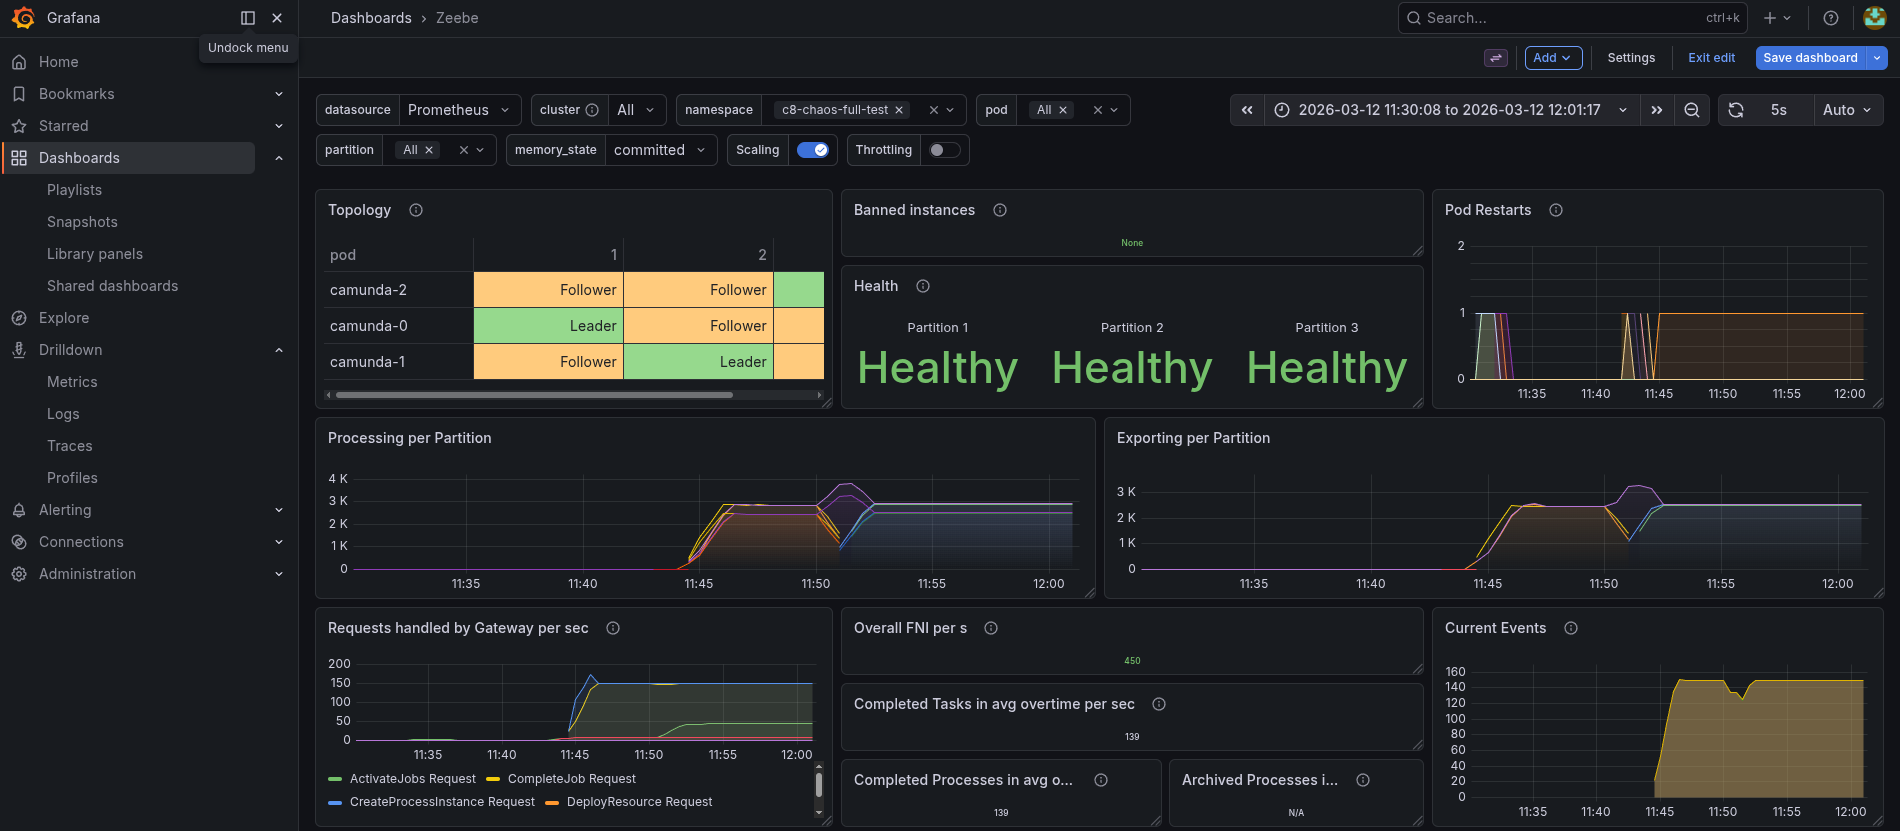
When we deleted the elastic-0 pod, we saw that the Exporting shortly dipped, but the processing was not generally impacted.
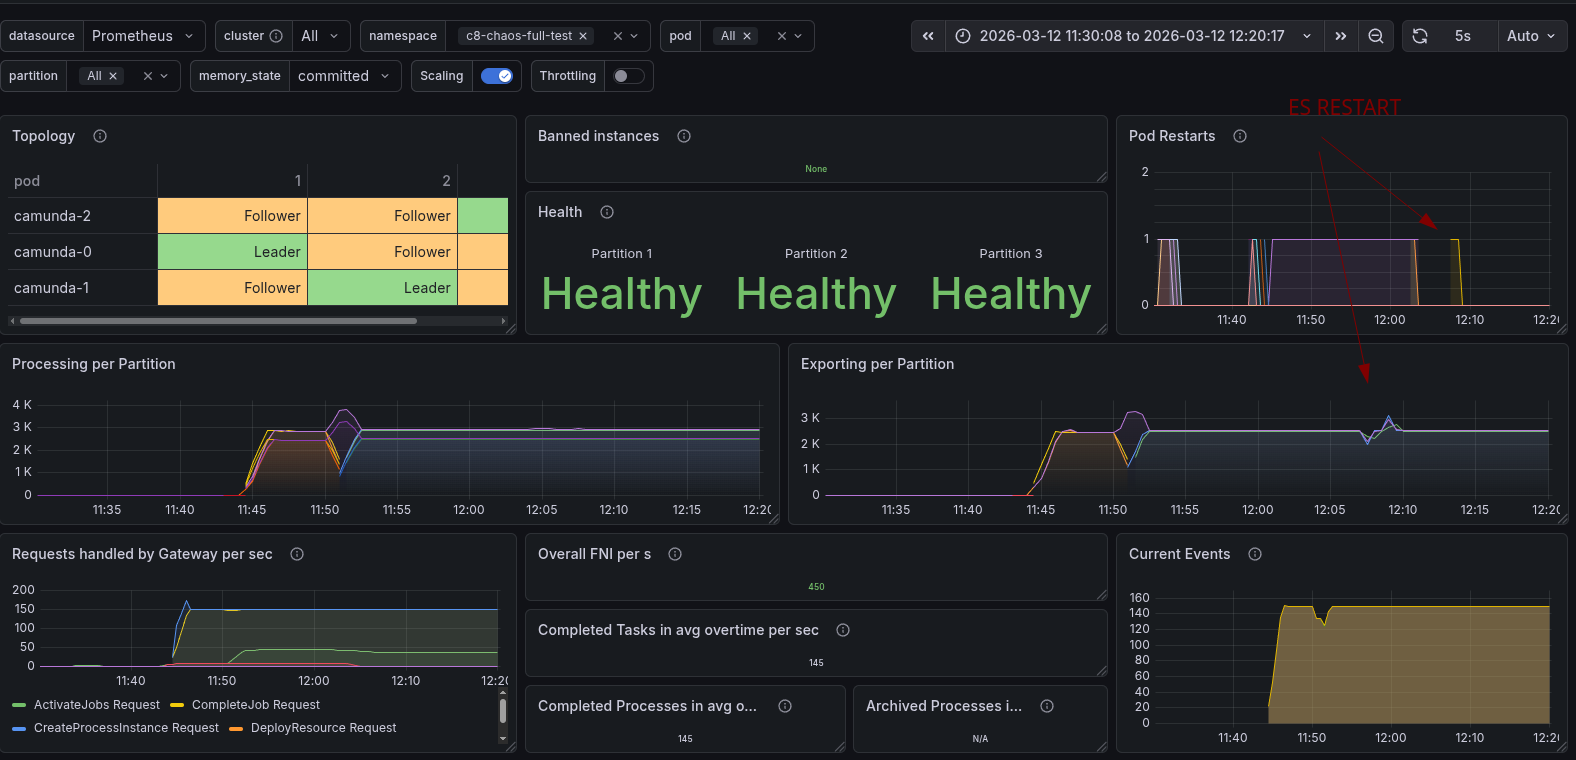
Looking at the data availability metrics, which we measure in our load test applications, we saw that it was increasing from ~5s to ~30s (p99).
Looking into this further, we can see that the Exporters had experienced a sort of backlog of unexported records during the time of ES unavailability.

As we were thinking and discussing this, we were actually expecting that with three ES nodes, there would be no impact.
Because of this, we investigated the ES logs further, and we saw exceptions of shards not available, and ES became RED.


Driven by these findings, we looked further into ES, as we expected some wrong configuration with the indices.

Indeed, we were able to find out that the zeebe-record indices had no replication configured.
This means when an Elasticsearch node goes down, the Elasticsearch Export will fail to flush. Normally, the exporters have a batch of around 1000 records, but eventually, they have to flush their data. If this fails, this will block further exporting.
This will not only block the Elasticsearch Exporter, which is needed for Optimize, but also the new CamundaExporter, which is writing the Operate and Tasklist indices.
This is why we see an increase in data availability during this time. If the availability takes longer than, what we have experienced ~2 minutes, then it might even cause more issues. Camunda supports a certain backlog until it starts to backpressure, and no longer accepts new incoming requests.
The good news is that this can be mitigated by configuring the Elasticsearch Exporter and the replica properly. This obviously requires a cluster of multiple Elasticsearch nodes, and has an additional impact on the load of ES, so this needs to be properly load tested as well.
Bad news, it seems not to be easy to configure with the current Helm Charts. Workaround is to use the extraConfiguration
Example configuration for the Elasticsearch Exporter can be found here. The index.numberOfReplicas configuration is not documented, but exposed here
Found Weaknesses / Learnings
- Bootstrapping Camunda now depends on ES, which makes bootstrapping take longer (compared to the previous architecture in 8.7)
- When ES indices are not set up properly, then a multi-node ES Cluster doesn't help. Unavailability of an ES Node will impact Camunda
- By default, the Helm Charts do not configure the replicas for ES Exporter indices
- In the Helm Chart, it is hard to configure. We must use the
extraConfiguration - The
index.numberOfReplicasconfiguration is not documented, but exposed here