
Using slow disk with Camunda

· 8 min read
Christopher Kujawa
Principal Software Engineer @ Camunda
Jonathan Ballet
Senior Software Engineer @ Reliability Testing Team

In today's Chaos Day, we wanted to experiment with slow disks, as we have recently run into some incidents related to that. We want to understand and document how Camunda behaves in such scenarios.

We have two main experiments planned: one for primary storage and one for secondary storage (in this case, Elasticsearch) using slow disks.

TL;DR; Using HDDs instead of SSDs on Camunda's primary storage caused around 50% throughput degradation — not because of lower disk throughput, but because of higher latency, which directly stalls Raft replication and commit acknowledgement. Moving the slow disk to Elasticsearch (secondary storage) was even worse, dropping throughput by ~70% and accumulating a permanent export backlog of ~200k records, with memory growing from unexported in-flight data. Both experiments confirm that SSDs are essential for both storage layers, and our documentation for secondary storage needs to be updated to reflect this.

Full-disk due to soft-pausing exporters

· 7 min read
Jonathan Ballet
Senior Software Engineer @ Reliability Testing Team
Christopher Kujawa
Principal Software Engineer @ Camunda

On today's Chaos Day, we wanted to experiment with disks filling up due to soft-paused exporters. We have recently encountered some incidents in which these disks filled up. We wanted to understand how Zeebe behaves in such scenarios. We had the following experiment planned: reproducing full disks because exporters are not confirming positions (due to soft-pausing).

TL;DR: We were able to reproduce the full-disk scenario with soft-pausing exporters. The node becomes unresponsive and rejects requests. After unpausing the exporters, we were able to free up disk space again, but it took a while because the exporters needed to re-export all unacknowledged records after the restart. Some interesting learnings from this experiment are that we should not keep exporters soft-paused for long. This can be especially problematic if nodes get restarted. When the disk is full, backpressure still reports zero, but all requests are rejected. Even REST requests are no longer successful.

Impact of Optimize on Cluster Resources and Performance

· 8 min read
Christopher Kujawa
Principal Software Engineer @ Camunda

On this Chaos Day, we measured the impact of Optimize on cluster performance and resource usage. We ran four 2-day load tests on Camunda 8.9.6 — two with Optimize enabled (max and realistic workloads) and two without — and compared throughput, latency, CPU, memory, and disk across all four.

TL;DR; Optimize has a measurable negative impact on throughput under high load (-22% completed PI/s), but the most striking finding is its additional CPU load on Elasticsearch and extra disk footprint at a realistic workload: Elasticsearch CPU was 3.4x higher with Optimize enabled. After two days at a realistic workload, the cluster with Optimize accumulated a maximum of 221.5 GiB of ES data, vs. 61.5 GiB without Optimize, a 3.6x difference. This is a critical finding for customers running Optimize at production scale, as it means that ES resources must be sized to account for Optimize's overhead, even at non-stress workloads.

Impact of High Process Deployments on Elasticsearch

· 6 min read
Pranjal Goyal
Senior Software Engineer @ Reliability Testing Team
Christopher Kujawa
Principal Software Engineer @ Camunda
Jonathan Ballet
Senior Software Engineer @ Reliability Testing Team

On this Chaos Day, we conducted an experiment to observe the impact on Elasticsearch when deploying a large number of process versions to a Camunda cluster, and how that pressure propagates through Optimize, the Zeebe Elasticsearch exporter, and ultimately back to the Camunda engine itself. During recent investigations, we identified a dependency between deployed process models and Elasticsearch shard usage, and wanted to experiment with it to understand what happens when we deploy X process models and where the actual limit lies.

TL;DR; We discovered a 1:1 relationship between Optimize indices and deployed processes, providing a clear, measurable limit on the number of process models that can coexist with Optimize on a given Elasticsearch cluster. Once the Elasticsearch cluster reaches its maximum normal shard limit (default 1000 per node, e.g., 3000 for a 3-node cluster), it stops creating new indices. The Zeebe engine remains unaffected initially, but the failure cascades the next day: once the Zeebe Elasticsearch exporter attempts to create its new dated index, the request is rejected, the exporter stalls, and the Camunda engine hits unrecoverable backpressure. Recovery requires manual intervention (raise cluster.max_shards_per_node, add nodes, or delete indices).

Performance of Camunda Platform without Secondary Storage

· 5 min read
Christopher Kujawa
Principal Software Engineer @ Camunda
Pranjal Goyal
Senior Software Engineer @ Reliability Testing Team
Jonathan Ballet
Senior Software Engineer @ Reliability Testing Team

On this Chaos Day, we conducted an experiment to evaluate the performance of our platform without the use of the secondary storage. The goal was to understand how the system behaves under such conditions and whether and how performance would improve.

TL;DR; We observed that a cluster without secondary storage achieves significantly higher throughput, as it is not throttled by secondary storage and can reach up to 400 PI/s without issues. That is a factor of 1.7x higher than the cluster with secondary storage.

REST API and OIDC

· 9 min read
Christopher Kujawa
Principal Software Engineer @ Camunda
Pranjal Goyal
Senior Software Engineer @ Reliability Testing Team
Jonathan Ballet
Senior Software Engineer @ Reliability Testing Team

Over the past weeks, we have been spending more time improving our load testing and reliability testing coverage. One of the things we did was to enable REST API (by default, we tend to use gRPC).

While doing such, we were experiencing a weird load pattern. This seems to occur when enabling the REST API usage in our load tester clients, together with OIDC.

On today's Chaos day, we want to verify how the system behaves when using the REST API and OIDC together, and how this changes under different loads and versions. We were also validating whether this was related to the cluster configuration (testing with SaaS).

TL;DR; We were seeing recurring throughput drops, especially at higher load (300 PIs), but at lower load they were not visible. The issue was reproducible in 8.8 as well, so it was not related to the changes in 8.9. We couldn't reproduce the pattern in SaaS, as we weren't able to achieve the same load with the small clusters we used. While experimenting, we discovered several areas for improvement. The root cause turned out to be JWT tokens expiring while requests queued in the Apache HttpAsyncClient connection pool. Nic fixed this by moving token injection to after connection acquisition via #50124 🚀

rest-bug

C8 on ECS: Simulate loss of lease

· 5 min read
Deepthi Akkoorath
Principal Software Engineer @ Camunda
Rodrigo Lopes
Associate Software Engineer @ Zeebe

With 8.9, we support C8 deployments on ECS. Camunda 8 is originally designed for Kubernetes StatefulSets, where each broker has a stable identity and disk. On Amazon ECS, tasks are ephemeral: IPs and container instances change frequently, and you rely on external storage like EFS and S3 instead of node-local disks.

To make this work safely, the Camunda 8 ECS reference architecture introduces a dynamic NodeIdProvider backed by Amazon S3. Each ECS task:

  • Competes for a lease stored in S3 that represents a specific logical broker node ID.
  • When it acquires the lease, it becomes that broker and uses a dedicated directory on shared EFS for its data.
  • Periodically renews the lease; if renewal fails or preconditions are violated, the task shts down immediately to avoid corrupting data or having two brokers think they own the same node.

In this experiment we explore what happens when a broker loses its S3-backed NodeId lease and another broker acquires it. In this experiment we simulate that scenario by artificially overwriting the lease object in S3 to represent a new owner and then observe how the original holder reacts.

Goal

Hypothesis:
If the S3 lease for a node Id is lost by the task, the NodeIdProvider should:

  • Detect the inconsistency via conditional writes,
  • Refuse to renew the lease,
  • Shut the broker down cleanly so that ECS can replace it with a fresh task that acquires a new, valid lease.

Setup

  • Camunda 8 (Zeebe) on AWS ECS Fargate
  • 3 brokers, 3 partitions
  • Shared data on EFS
  • NodeIdProvider using S3 leases:
    • One object per logical node (e.g. 2.json)
    • Metadata carries the task id, version, and acquirable flag
    • Object body holds the lease payload (node id, version, known version mappings, timestamp)

Before the experiment, the S3 object for node 2 looked like this.

Metadata:

"Metadata": {
"taskid": "0afffc8d-3807-46cb-9a2e-3f65f96d2acb",
"version": "2",
"acquirable": "true"
}

Payload:

{
"taskId": "0afffc8d-3807-46cb-9a2e-3f65f96d2acb",
"timestamp": 1774433501584,
"nodeInstance": { "id": 2, "version": 2 },
"knownVersionMappings": {
"mappingsByNodeId": {
"0": 2,
"1": 3,
"2": 2
}
}
}

This represents broker node 2, version 2, with a lease that is currently acquirable.

Injecting failure: overwriting the lease in S3

To simulate the loss of the lease, we modified the timestamp and the taskId in the current 2.json object and overwrote the object.

aws s3api put-object \
--bucket "dev-chaos-day-oc-bucket" \
--key "2.json" \
--body 2.json \
--metadata "version=2,acquirable=true,taskId=abc"

From the broker’s point of view, the lease it thought it owned has now been rewritten by someone else. In a real cluster, this situation should not occur as long as the current holder keeps renewing its lease within the configured lease duration. The overwrite here is artificial and is meant to simulate a scenario where the current holder has stopped renewing, and another broker has legitimately acquired the lease in the meantime.

What we observed in the logs

Shortly after the override, the task assuming the role of node 2 started logging S3 errors during lease renewal:

  • S3 precondition failure (HTTP 412) while trying to acquire/renew the lease:
    • S3Exception: At least one of the pre-conditions you specified did not hold (Status Code: 412)
  • The NodeIdProvider logs clearly indicate:
    • “Failed to renew the lease: process is going to shut down immediately.”
    • “NodeIdProvider terminating the process.”

Once the NodeIdProvider decides the lease can’t be renewed safely, the broker begins a controlled shutdown. From the outside, this looks like a broker failure triggered by lease validation logic, not by ECS itself.

March 25, 2026, 11:20
[2026-03-25 10:20:41.663] [NodeIdProvider] WARN io.camunda.zeebe.dynamic.nodeid.RepositoryNodeIdProvider - Failed to renew the lease: process is going to shut down immediately. software.amazon.awssdk.services.s3.model.S3Exception: At least one of the pre-conditions you specified did not hold ...
March 25, 2026, 11:20
[2026-03-25 10:20:41.663] [NodeIdProvider] WARN io.camunda.zeebe.broker.NodeIdProviderConfiguration - NodeIdProvider terminating the process

Replacement task and new lease

ECS notices that the service is now below the desired task count and starts a replacement task for the orchestration cluster:

  1. The old task transitions to stopped.

  2. A new ECS task is started for the same service.

  3. On startup, the new task:

    • Acquires a new S3 lease for node 2 with version 3:
      • New taskid in metadata (the new ECS task id),
      • "version": "3",
      • "acquirable": "true".
    • Initializes a new data directory:
      • /usr/local/camunda/data/node-2/v3 is created by copying from /usr/local/camunda/data/node-2/v2.
    • Starts rest of the services and joins the cluster.
March 25, 2026, 11:24
[2026-03-25 10:24:12.031] [main] INFO io.camunda.zeebe.dynamic.nodeid.fs.VersionedNodeIdBasedDataDirectoryProvider - Initializing data directory /usr/local/camunda/data/node-2/v3 by copying from /usr/local/camunda/data/node-2/v2
orchestration-cluster
March 25, 2026, 11:24
[2026-03-25 10:24:11.480] [NodeIdProvider] INFO io.camunda.zeebe.dynamic.nodeid.RepositoryNodeIdProvider - Acquired lease w/ nodeId=NodeInstance[id=2, version=Version[version=3]]. Initialized[metadata=Metadata[task=Optional[6670d8e5-ec20-4c03-9d99-6993f48b6617], version=Version[version=3], acquirable=true], lease=Lease[taskId=6670d8e5-ec20-4c03-9d99-6993f48b6617, timestamp=1774434266329, nodeInstance=NodeInstance[id=2, version=Version[version=3]], knownVersionMappings=VersionMappings[mappingsByNodeId={2=Version[version=3]}]], eTag="98e0408dfd5c07143686697207d411df"]

The resulting S3 object now represents node 2, version 3, with a fresh lease owned by the new task.
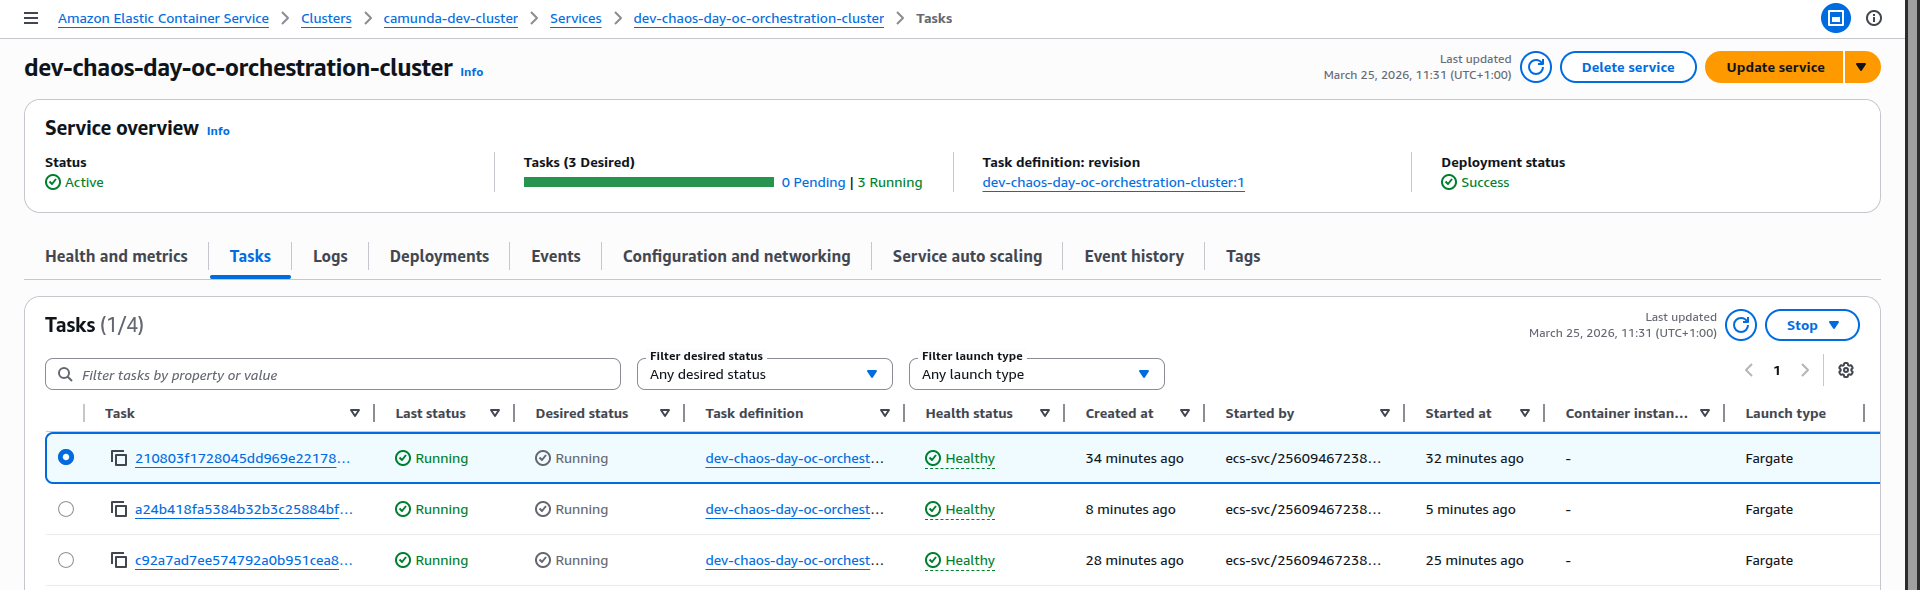
In ECS:

  • The Tasks view shows three running tasks, all Healthy again.
  • From the cluster’s perspective, we’re back to a stable, 3-broker topology.

Healthy Service

Takeaways

Overall, this experiment shows that when a broker loses its lease and another broker acquires it, the combination of NodeIdProvider safety checks and ECS rescheduling steers the system toward a safe recovery path rather than silent data corruption.

C8 on ECS: Restart Tasks

· 5 min read
Deepthi Akkoorath
Principal Software Engineer @ Camunda
Rodrigo Lopes
Associate Software Engineer @ Zeebe

With 8.9, we support C8 deployments on ECS. Camunda 8 is originally designed for Kubernetes StatefulSets, where each broker has a stable identity and disk. On Amazon ECS, tasks are ephemeral: IPs and container instances change frequently, and you rely on external storage like EFS and S3 instead of node-local disks.

To make this work safely, the Camunda 8 ECS reference architecture introduces a dynamic NodeIdProvider backed by Amazon S3. Each ECS task:

  • Competes for a lease stored in S3 that represents a specific logical broker node ID.
  • When it acquires the lease, it becomes that broker and uses a dedicated directory on shared EFS for its data.
  • Periodically renews the lease; if renewal fails or preconditions are violated, the task shts down immediately to avoid corrupting data or having two brokers think they own the same node.

The experiments in this post tests how well this S3-backed lease mechanism behaves under specfic failure scenarios where a task is killed and replaced by a new one.

Experiment

Our first chaos experiment on ECS was simple: what happens to a Camunda 8 cluster on AWS ECS when we kill a single broker task by hand?

The cluster was running Camunda 8 (Zeebe) on AWS ECS with 3 brokers and 3 partitions. Before we started the experiment, the dashboards showed a healthy topology, stable processing and exporting rates. The AWS console confirmed three running, healthy tasks for the orchestration cluster service.

Baseline: healthy 3-broker cluster

At steady state:

  • Cluster topology: 3 brokers, each participating in the 3 partitions as leader or follower.
  • Health: All partitions reported as healthy, with no restarts.
  • Throughput: Processing and exporting metrics were flat and stable.
  • ECS: Service view showed 3/3 tasks running and healthy.

Dashboard showing healthy brokers

AWS console showing healthy tasks

Injecting failure: stopping one ECS task

To inject a failure, we manually stopped one of the ECS tasks for the orchestration cluster from the AWS console.

Stop task from AWS console

This triggers a graceful shutdown of the broker, and we can see that NodeIdProvider released its S3 lease.

March 25, 2026, 10:34
[2026-03-25 09:34:19.666] [NodeIdProvider] INFO io.camunda.zeebe.dynamic.nodeid.repository.s3.S3NodeIdRepository - Release lease Initialized[metadata=Metadata[task=Optional[03acfc2a-6ff8-4e76-8e56-0a2a4e7227e7], version=Version[version=1], acquirable=true], lease=Lease[taskId=03acfc2a-6ff8-4e76-8e56-0a2a4e7227e7, timestamp=1774431273727, nodeInstance=NodeInstance[id=1, version=Version[version=1]], knownVersionMappings=VersionMappings[mappingsByNodeId={0=Version[version=1], 1=Version[version=1], 2=Version[version=1]}]], eTag="07b2daecf534e87cae5a3993f1102b22"]
orchestration-cluster
March 25, 2026, 10:34
[2026-03-25 09:34:19.638] [SpringApplicationShutdownHook] [{broker-id=Broker-1}] INFO io.camunda.zeebe.broker.system - Broker shut down.
orchestration-cluster```

Replacement task and recovery

ECS replaces the stopped task to meet the configured desired task count.

  1. The old task went into deprovisioning and eventually stopped.

Deprovisioning

  1. ECS launched a new task for the same service a couple of minutes later.

Provisioning 3. On startup, the new broker instance:

  • Acquired the S3 lease for the same logical node with a new version (v2).
  • Copied the previous data directory into a fresh v2 directory (versioned data layout).
March 25, 2026, 10:36
[2026-03-25 09:36:27.555] [main] INFO io.camunda.zeebe.dynamic.nodeid.fs.VersionedNodeIdBasedDataDirectoryProvider - Initializing data directory /usr/local/camunda/data/node-1/v2 by copying from /usr/local/camunda/data/node-1/v1
orchestration-cluster
March 25, 2026, 10:36
[2026-03-25 09:36:27.037] [main] WARN io.camunda.configuration.beanoverrides.BrokerBasedPropertiesOverride - The following legacy property is no longer supported and should be removed in favor of 'camunda.data.exporters': zeebe.broker.exporters
orchestration-cluster
March 25, 2026, 10:36
[2026-03-25 09:36:26.979] [main] WARN io.camunda.configuration.UnifiedConfigurationHelper - The following legacy configuration properties should be removed in favor of 'camunda.data.primary-storage.directory': zeebe.broker.data.directory
orchestration-cluster
March 25, 2026, 10:36
[2026-03-25 09:36:26.912] [NodeIdProvider] INFO io.camunda.zeebe.dynamic.nodeid.RepositoryNodeIdProvider - Acquired lease w/ nodeId=NodeInstance[id=1, version=Version[version=2]]. Initialized[metadata=Metadata[task=Optional[5228b3d3-7cde-4365-b4c5-7afd0ae094cd], version=Version[version=2], acquirable=true], lease=Lease[taskId=5228b3d3-7cde-4365-b4c5-7afd0ae094cd, timestamp=1774431401724, nodeInstance=NodeInstance[id=1, version=Version[version=2]], knownVersionMappings=VersionMappings[mappingsByNodeId={1=Version[version=2]}]], eTag="9f0c6e1c2a92bbaa1fde872e1d545e05"]
orchestration-cluster

The new task becomes healthy and the orchestration cluster service is now fully healthy.

Recovered

What we learned

This first experiment validated that:

  • S3-based leases behave correctly under node loss: when a task is killed, the broker releases its lease, and a new task can safely acquire a new versioned lease.
  • Graceful shutdown still happens under forced task stop: even though we stopped the task from the ECS console, the broker had enough time to drain and shut down its internal components cleanly.
  • Replace task becomes healthy: the replacement task comes up, reuses the data via a new versioned directory, and rejoins the cluster without any issues.

RTO with varying backup schedules

· 7 min read
Lena Schönburg
Senior Software Engineer @ Zeebe

With the upcoming Camunda 8.9 release, we will support RDBMS as secondary storage as an alternative to Elasticsearch and OpenSearch. Because there is no common API for taking backups of relational databases, we had to revise our approach to backup and restore significantly. We now support a continuous backup mode that allows users to take backups of secondary and primary storage independently from each other. Backups of primary storage will cover a contiguous time range, allowing us to restore from one or multiple primary storage backups to match the state in secondary storage.

In this chaos day, we are testing our Recovery Time Objective (RTO), the time it takes to recover data from backups and become fully operational again, with varying backup schedules. When backups are taken less frequently, each backup covers a longer time window and therefore includes more accumulated log segments. We want to understand how this translates to RTO.

Checkpoint scheduler resiliency

· 8 min read
Panagiotis Goutis
Software Engineer @ Zeebe

With the introduction of RDBMS support in Camunda 8.9, we needed a reliable and consistent mechanism to automatically back up Zeebe's primary storage. It was mandatory to have a resilient scheduling mechanism that was able to survive cluster disruptions. To address this, we introduced scheduled backups, which allow operators to have a deterministic mechanism to back up the cluster's primary storage.

This experiment validates the resiliency of the Checkpoint Scheduler services under adverse conditions. Specifically, we test whether this critical service can maintain its configured schedule when brokers are disconnected and cluster topology changes occur, ensuring continuous backup operation even during partial cluster failures.

Scheduler introduction

To guarantee the continuity and correctness of primary storage backups, it was required to have a cluster-level service responsible for performing backups at predefined intervals. For this reason, we introduced the Checkpoint Scheduler, which serves as the timekeeper of checkpoint creation in the cluster, fanning out the creation of checkpoints to all partitions.

The scheduler is always assigned to the broker with the lowest id that is part of the replication cluster. Under normal operation, that would mean that the camunda-0 pod is the one with the service registered. The scheduler's interval, while preconfigured, is dynamic and will adapt to network issues in a best-effort manner to maintain the desired interval.

Currently, it supports two types of checkpoints:

  • MARKER: Used as reference points for point-in-time restore operation
  • SCHEDULED_BACKUP: Trigger a primary storage backup

Alongside the scheduler, a retention service is also registered on the same broker if a retention schedule is configured. This service is responsible for deleting backups outside the configured window to reduce storage costs. Furthermore, backups that are too old are not that useful in a disaster recovery scenario.

The checkpoint scheduler and the retention mechanism can be configured via the available options.

Chaos experiment

Expected outcomes

The expectation of this experiment is to prove that the checkpoint and backup scheduler is resilient to network and topology changes that can occur within a cluster's lifespan.

Setup

In this experiment, we'll be using a standard Camunda 8.9 Kubernetes installation with the checkpoint scheduler and retention enabled. The installation consists of 3 brokers in the camunda stateful set, labeled as camunda-0, camunda-1 and camunda-2.

Enabling the scheduler

To enable the checkpoint & backup schedulers, we supply the following configuration parameters for the camunda stateful set:

CAMUNDA_DATA_PRIMARYSTORAGE_BACKUP_CONTINUOUS=true
CAMUNDA_DATA_PRIMARYSTORAGE_BACKUP_CHECKPOINTINTERVAL=PT1M
CAMUNDA_DATA_PRIMARYSTORAGE_BACKUP_SCHEDULE=PT3M
CAMUNDA_DATA_PRIMARYSTORAGE_BACKUP_RETENTION_WINDOW=PT30M
CAMUNDA_DATA_PRIMARYSTORAGE_BACKUP_RETENTION_CLEANUPSCHEDULE=PT10M

This means that we take a full Zeebe backup every 3 minutes and inject marker checkpoints into the log stream every 1 minute. We also want to maintain a rolling window of 30 minutes' worth of backups, and we check for backups to be deleted every 10 minutes.

Node disconnect

To simulate disconnecting a node from the Camunda Orchestration cluster, we can use a simple Kubernetes network policy:

apiVersion: networking.k8s.io/v1
kind: NetworkPolicy
metadata:
name: isolate-pod
namespace: <namespace>
spec:
podSelector:
matchLabels:
isolated: "true"
policyTypes:
- Ingress
- Egress

This policy matches the given label isolated present on deployed pods; disconnecting a node just requires applying this label. For example, kubectl label pod camunda-0 isolated=true --overwrite will result in the pod camunda-0 being removed from the Orchestration cluster.

Experiment

Starting the cluster

Upon applying this configuration we see the following logs being produced, verifying the presence of the scheduler:

logs-image

You may notice that these logs are present on all brokers; this is intentional, as the service being active is based on the intra-cluster discovery protocol, which is updated in real-time. This means that when, for example, camunda-0 is considered gone, camunda-1 is ready to take over the service and pick up where it should.

Also, the first backup has already been taken. As there was no previous backup present, an immediate one is captured. With that in mind, if a cluster sustains a prolonged unhealthy state for more than the configured backup interval, the next backup will be immediately taken once the cluster reaches a healthy state.

Our Grafana dashboard will start displaying scheduler data:

startup-metrics

After the first 3 minutes pass, according to the backup interval, we should have a second backup available:

first-backup-metrics

and the corresponding logs related to it with the matching timestamps:

first-backup-logs

Inspecting the logs further, we see that the initiating node of that backup was the pod camunda-0, which is expected.

first-backup-pod

The checkpoints can also be verified by querying Zeebe's internal state via the actuator. Notice in the following response that the checkpointId for the backups and for the active ranges matches what's seen in the metrics as well.

The result contains a single partition's state to reduce size

curl localhost:9600/actuator/backupRuntime/state

{
"checkpointStates": [
{
"checkpointId": 1773840131794,
"checkpointType": "MARKER",
"partitionId": 2,
"checkpointPosition": 1695,
"checkpointTimestamp": "2026-03-18T13:22:11.781+0000"
}
],
"backupStates": [
{
"checkpointId": 1773840011037,
"checkpointType": "SCHEDULED_BACKUP",
"partitionId": 2,
"checkpointPosition": 1465,
"firstLogPosition": 1,
"checkpointTimestamp": "2026-03-18T13:20:13.001+0000"
}
],
"ranges": [
{
"partitionId": 2,
"start": {
"checkpointId": 1773839828707,
"checkpointType": "SCHEDULED_BACKUP",
"checkpointPosition": 1095,
"firstLogPosition": 1,
"checkpointTimestamp": "2026-03-18T13:17:10.852+0000"
},
"end": {
"checkpointId": 1773840011037,
"checkpointType": "SCHEDULED_BACKUP",
"checkpointPosition": 1465,
"firstLogPosition": 1,
"checkpointTimestamp": "2026-03-18T13:20:13.001+0000"
}
}
]
}

Disconnecting camunda-0

Executing kubectl label pod camunda-0 isolated=true --overwrite causes broker 0 to be disconnected from the cluster. For the scheduling service, this effectively means that it should be handed over to the camunda-1 broker. Sure enough, the logs confirm this:

handover-logs

handover-logs-pod

The logs clearly show that the next backup is scheduled in 46,301ms (approximately 46 seconds), which is significantly less than the configured 180,000ms (3-minute) interval. This behavior is intentional and demonstrates the scheduler's dynamic interval adjustment. Rather than waiting a full 3 minutes from the handover, the scheduler calculates the remaining time based on when the last backup completed. This approach ensures that backups remain on schedule even when the scheduler service transfers between brokers, preventing schedule drift that would occur if the interval were reset on each handover.

Disconnecting camunda-1

Applying the isolated label on camunda-1 causes the cluster to reach an unhealthy state, since it has now suffered 2 node losses. The remaining node, camunda-2, cannot form a cluster and is unable to proceed in the startup sequence to start initiating backups.

Rejoining brokers

Removing the label from the disconnected pods,

kubectl label pod camunda-0 isolated-
kubectl label pod camunda-1 isolated-

causes yet another handover, this time back to the camunda-0 node, and the schedule's execution continues as expected.

next-backup

next-backup-execution

Bonus: Retention

Having the cluster running long enough causes retention to kick in, so its metrics and results are also available in the dashboard. We can see that we have 3 backups deleted for each partition.

retention

We also see the earliest backup still present that was not picked up by retention, 1773840375165. Looking in the logs, we can also confirm its execution time, 15:26.

retention-earliest

Since our backups started at 15:17, we expect to have backups available at the following timestamps:

  • 15:17
  • 15:20
  • 15:23
  • 15:26
  • 15:29...

Since retention was executed at 15:55, the reported count of backups pruned is on par with what's expected. Backups taken at 15:17, 15:20, and 15:23 all satisfy being 30 minutes before the retention mechanism execution.

Conclusion

In this experiment, we've validated that the checkpoint and backup scheduler can maintain the configured backup interval while surviving broker disconnects and topology changes. The service successfully demonstrated automatic failover, transferring from camunda-0 to camunda-1 when the primary broker was isolated, and seamlessly returning control when the original broker rejoined the cluster.

Key findings include:

  1. Automatic failover: The scheduler service correctly reassigns to the next available broker with the lowest ID when the current scheduler node becomes unavailable
  2. Dynamic interval adjustment: The scheduler adapts its timing to compensate for disruptions, ensuring backups remain on schedule despite temporary delays
  3. Retention reliability: The retention mechanism functions properly, maintaining the configured rolling window and properly cleaning up expired backups

These results confirm that operators can rely on the checkpoint scheduler to maintain continuous backup operations even with cluster-level disruptions, guaranteeing the system's ability to properly maintain the configured schedule without manual intervention.