Hypothesis
The objective of this chaos day is to estimate the scalability of Zeebe when brokers and partitions are
scaled together: we expect to be able to see the system scaling linearly with the number of brokers/partition
in terms of throughput and back pressure, while maintaining predictable latency.
General Experiment setup
To test this, we ran a benchmark using the latest alpha version of Camunda 8.8.0-alpha6, with the old
ElasticsearchExporter disabled, and the new CamundaExporter enabled. We also made sure Raft
leadership was balanced before starting the test, meaning each broker is leader for exactly one partition,
and we turned on partition scaling by adding the following environment variable:
ZEEBE_BROKER_EXPERIMENTAL_FEATURES_ENABLEPARTITIONSCALING=true
Each broker also has a SSD-class volume with 32GB of disk space, limiting them to a few thousand IOPS.
The processing load was 150 processes per second, with a large payload of 32KiB each. Each process instance has
a single service task:
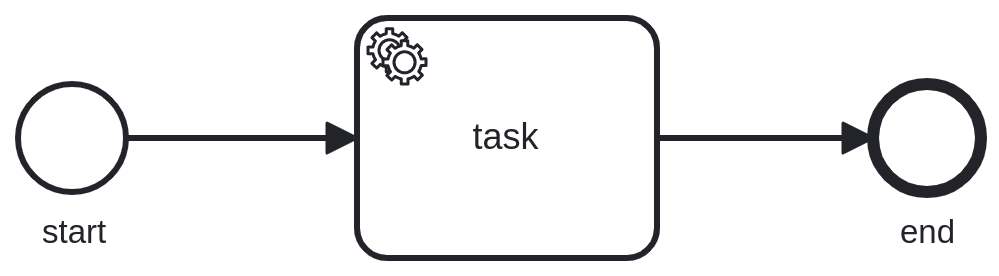
The processing load is generated by our own benchmarking application.
Initial cluster configuration
To test this hypothesis, we will start with a standard configuration of the Camunda orchestration cluster:
- 3 nodes
- 3 partitions
- CPU limit: 2
- Memory limit: 2 GB
We will increase the load through a load generator in fixed increments until we start to see the nodes showing constant non zero backpressure,
which is a sign that the system has hit its throughput limits.
Target cluster configuration
Once that level of throughput is increased, we will scale broker & partitions while the cluster is under load to the new target value:
- 6 nodes
- 6 partitions
- CPU limit: 2
- Memory limit: 2 GB
Experiment
We expect that during the scaling operation the backpressure/latencies might worsen,
but only temporarily, as once the scaling operation has completed,
the additional load it generate is not present anymore.
Then, we will execute the same procedure as above,
until we hit 2x the critical throughput hit before.
Expectation
If the system scales linearly, we expect to see similar level of performance metrics
for similar values of the ratios PI (created/complete) per second / nr. of partition.
Steady state
The system is started with a throughput of 150 Process instances created per second.
As this is a standard benchmark configuration, nothing unexpected happens:
- The same number of process instances are completed as the ones created
- The expected number of jobs is completed per unit of time
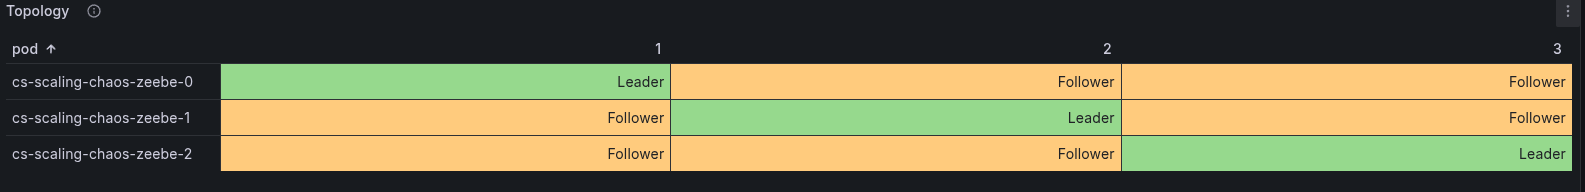
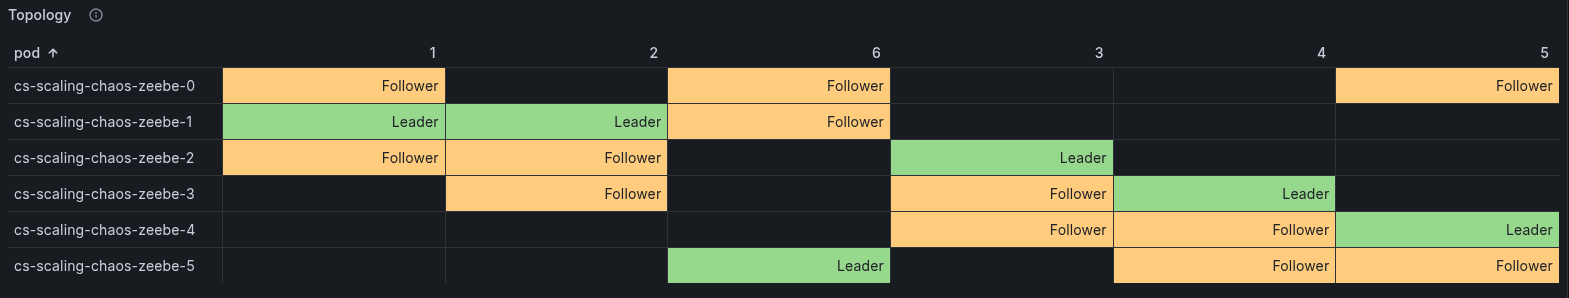
At this point, we have the following topology:
First benchmark: 3 broker and 3 partitions
Let's start increasing the load incrementally, by adding 30 Process instances/s for every step.
| Time | Brokers | Partitions | Throughput | CPU Usage | Throttling (CPU) | Backpressure |
|---|
| 09:30 | 3 | 3 | 150 PI/s, 150 jobs/s | 1.28 / 1.44 / 1.02 | 12% / 7% / 1% | 0 |
| 09:49 | 3 | 3 | 180 PI/s, 180 jobs/s | 1.34 / 1.54 / 1.12 | 20% / 17% / 2% | 0 |
| 10:00 | 3 | 3 | 210 PI/s, 210 jobs/s | 1.79 / 1.62 / 1.33 | 28% / 42% / 4% | 0 |
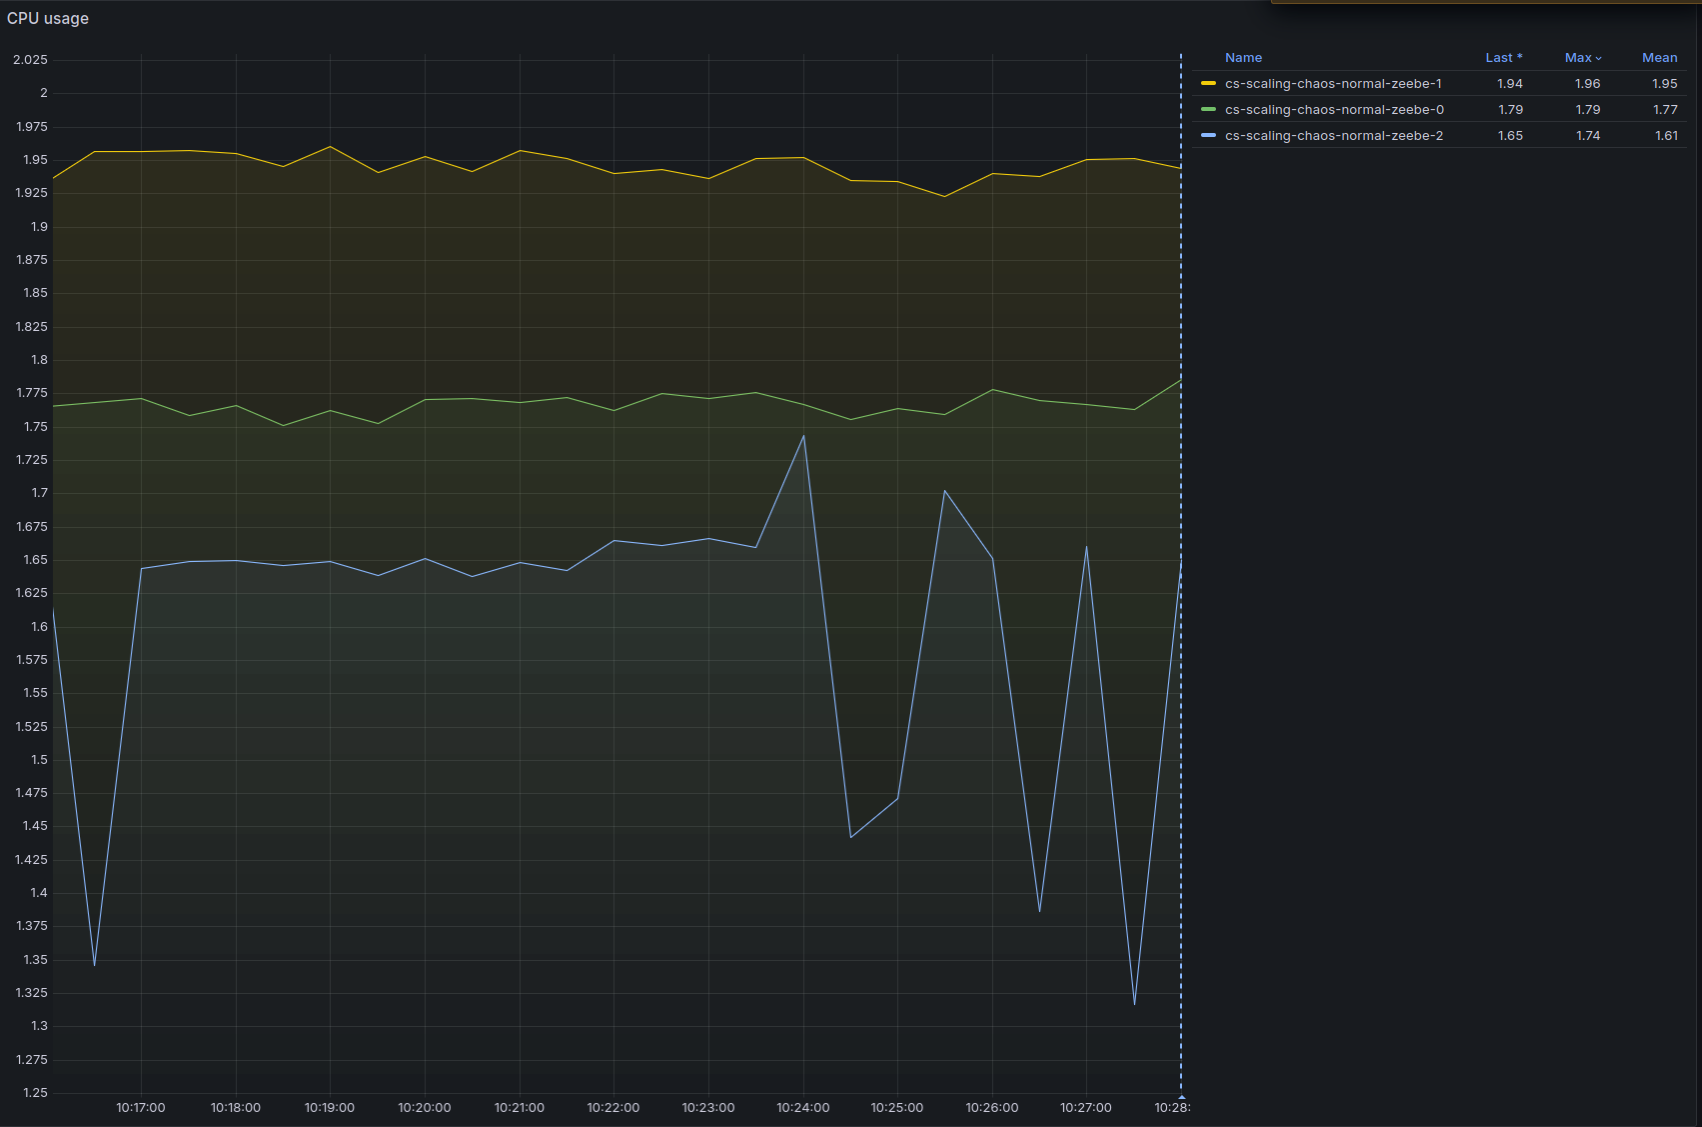
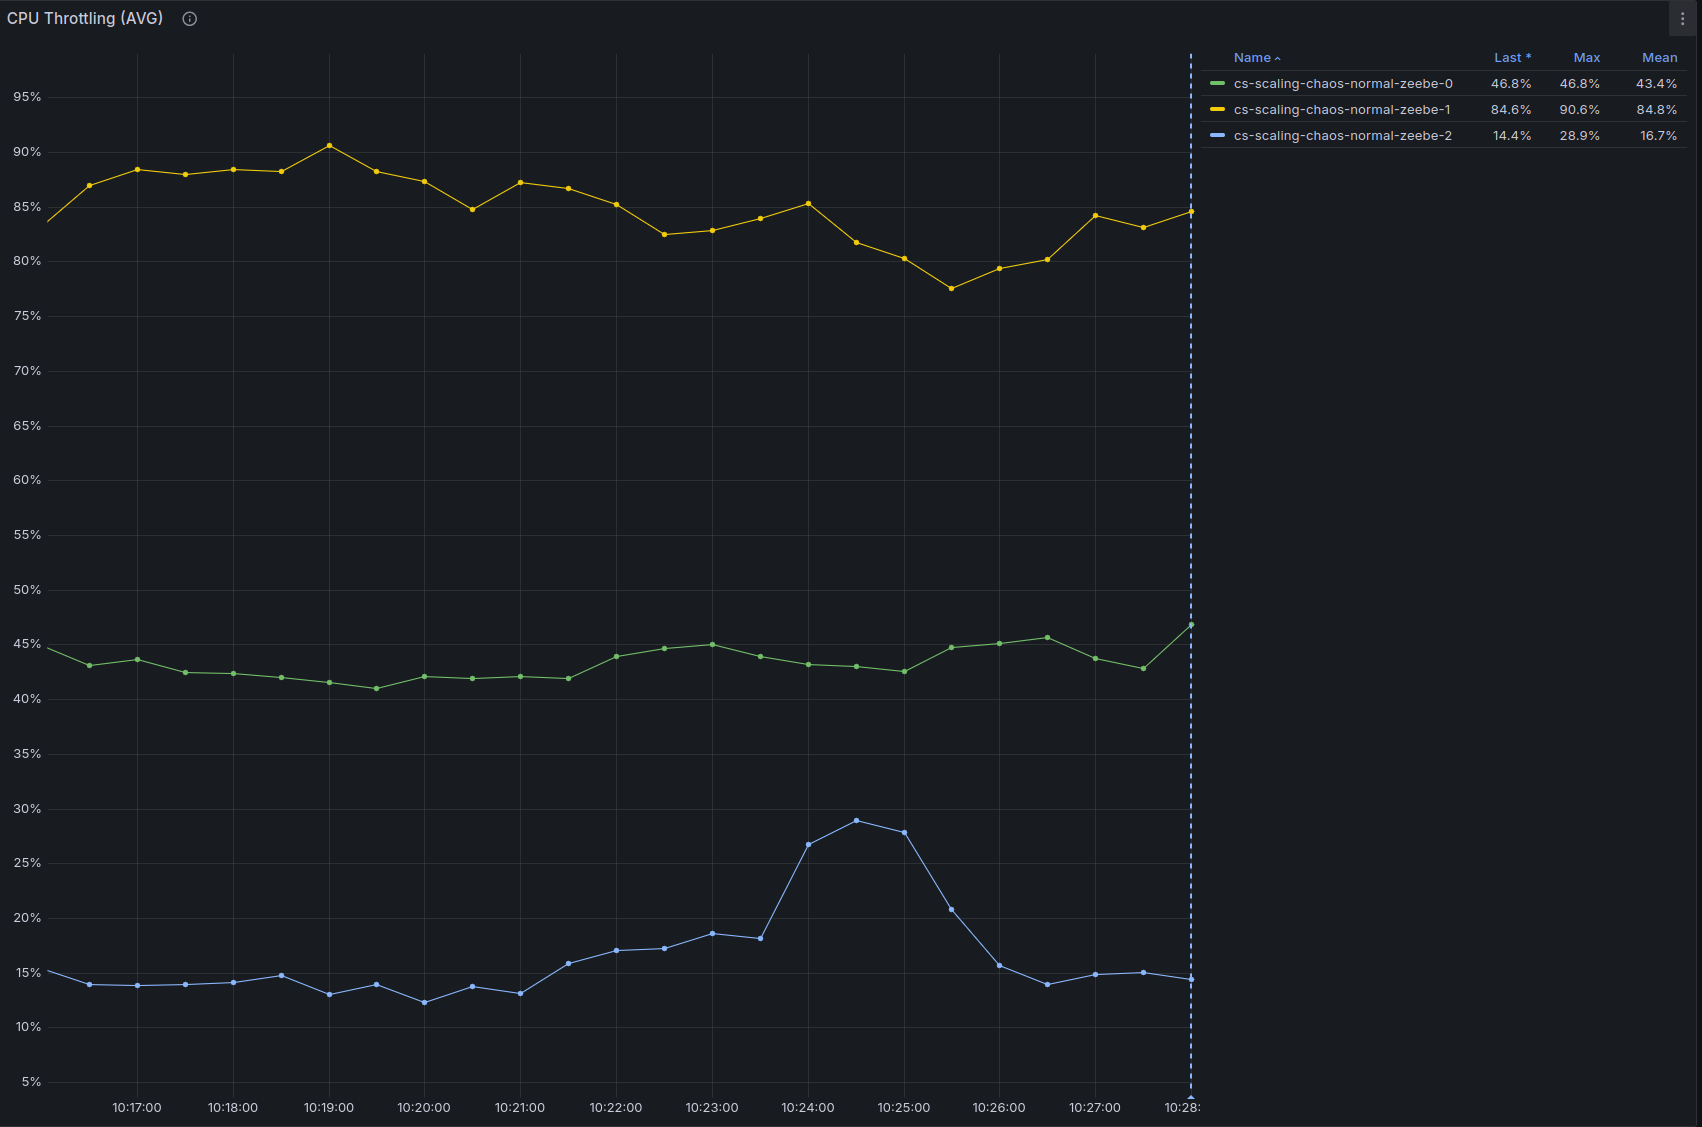
| 10:12 | 3 | 3 | 240 PI/s, 240 jobs/s | 1.77 / 1.95 / 1.62 | 45% / 90% / 26% | 0/0.5% |
At 240 Process Instances spawned per second, the system starts to hit the limits:
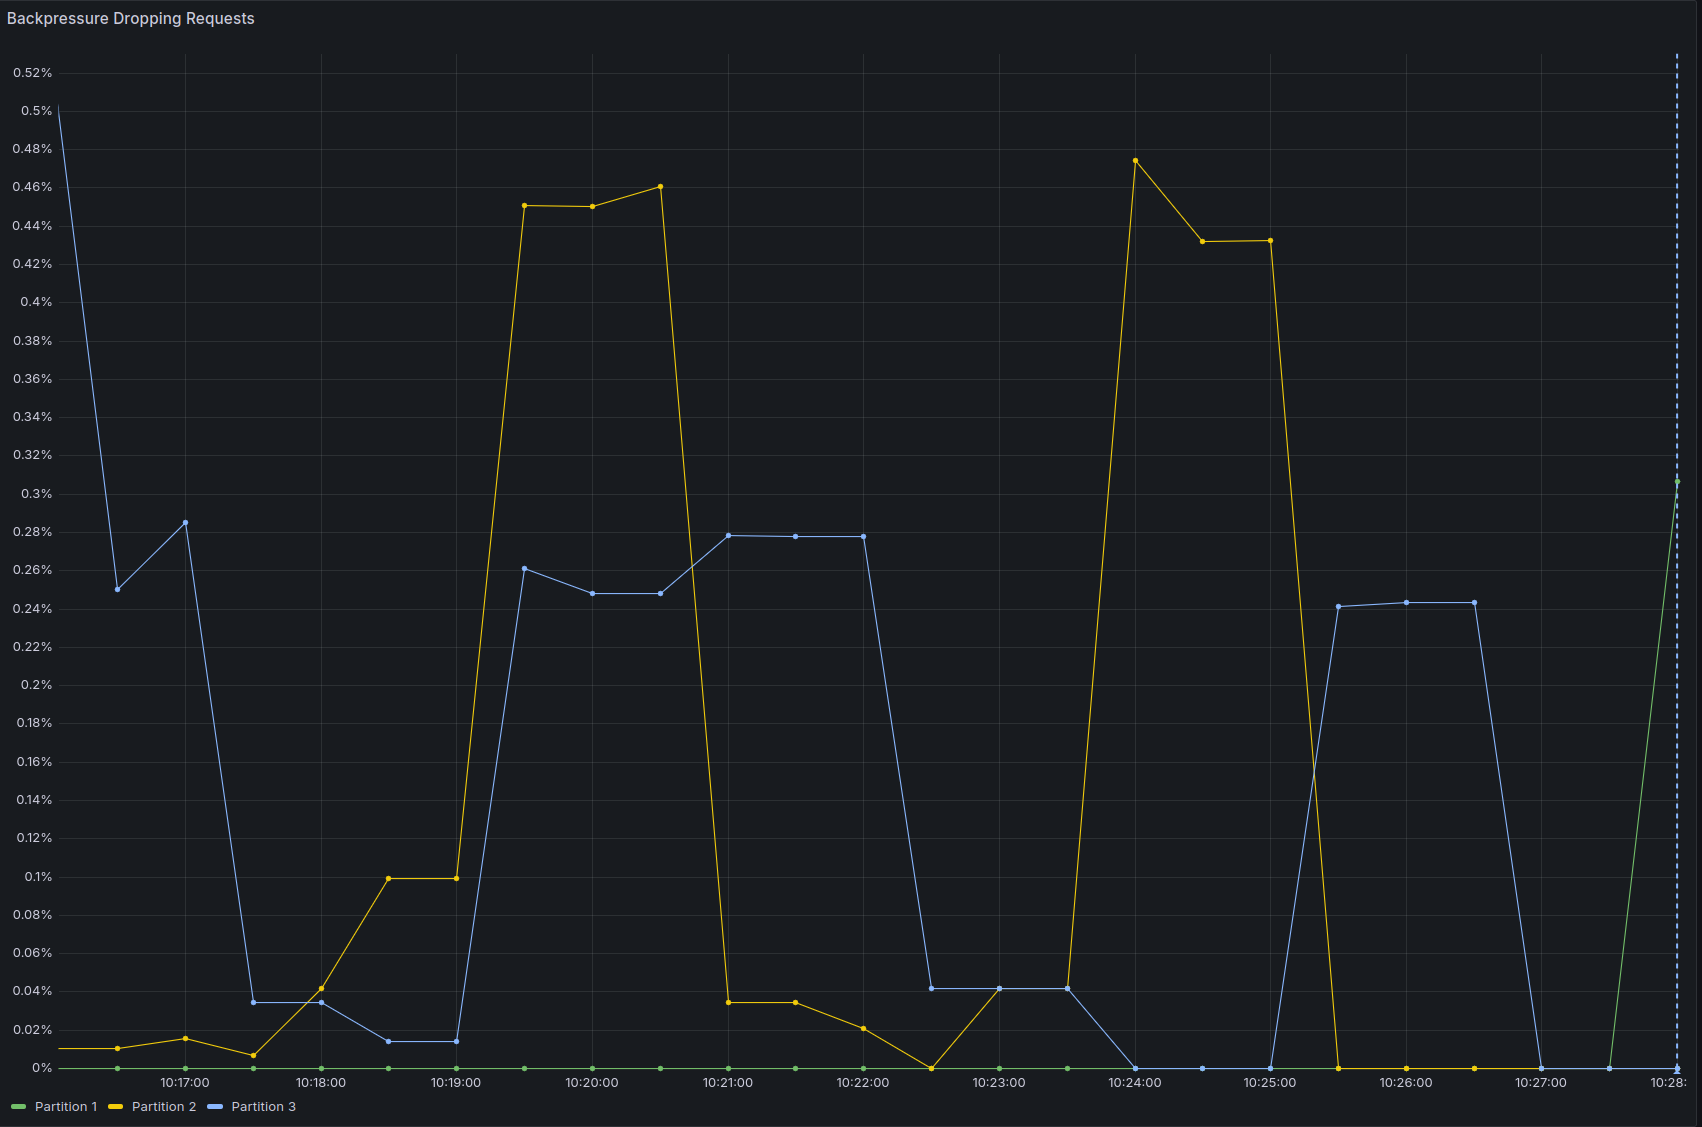
And the backpressure is not zero anymore:
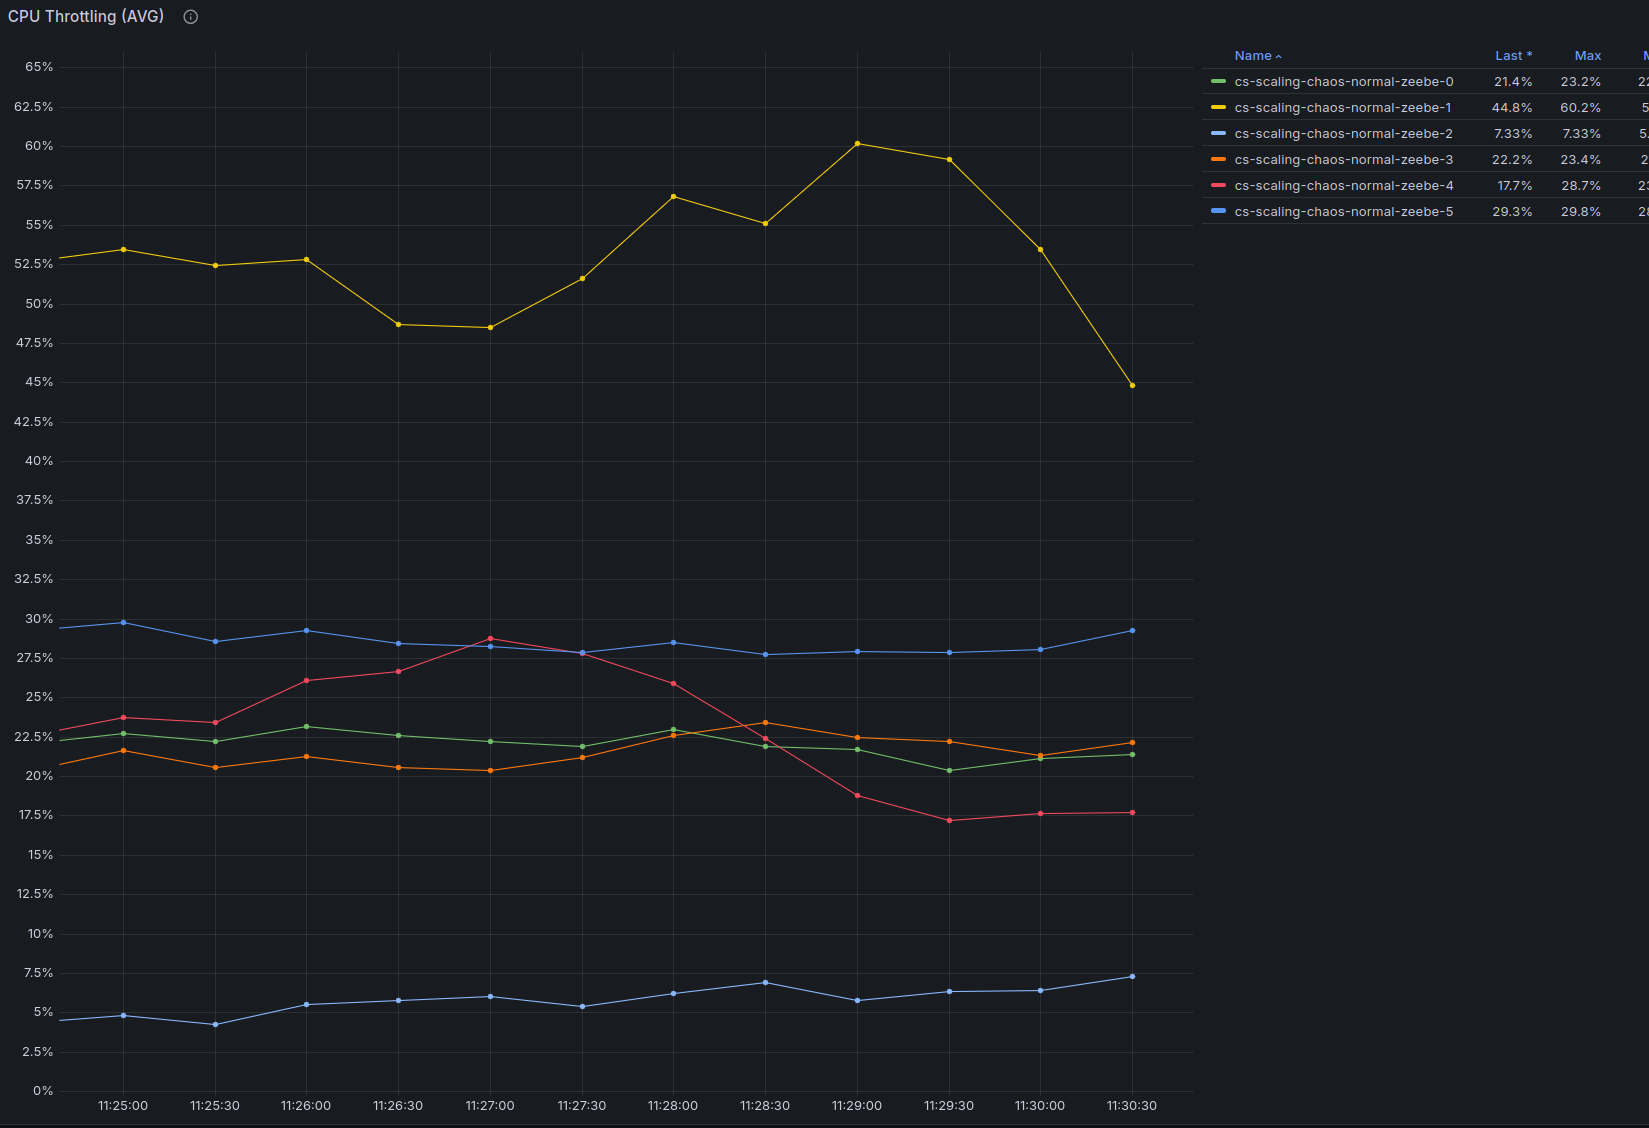
- The CPU throttling reaches almost 90% on one node (this is probably caused by only one node being selected as gateway as previously noted)
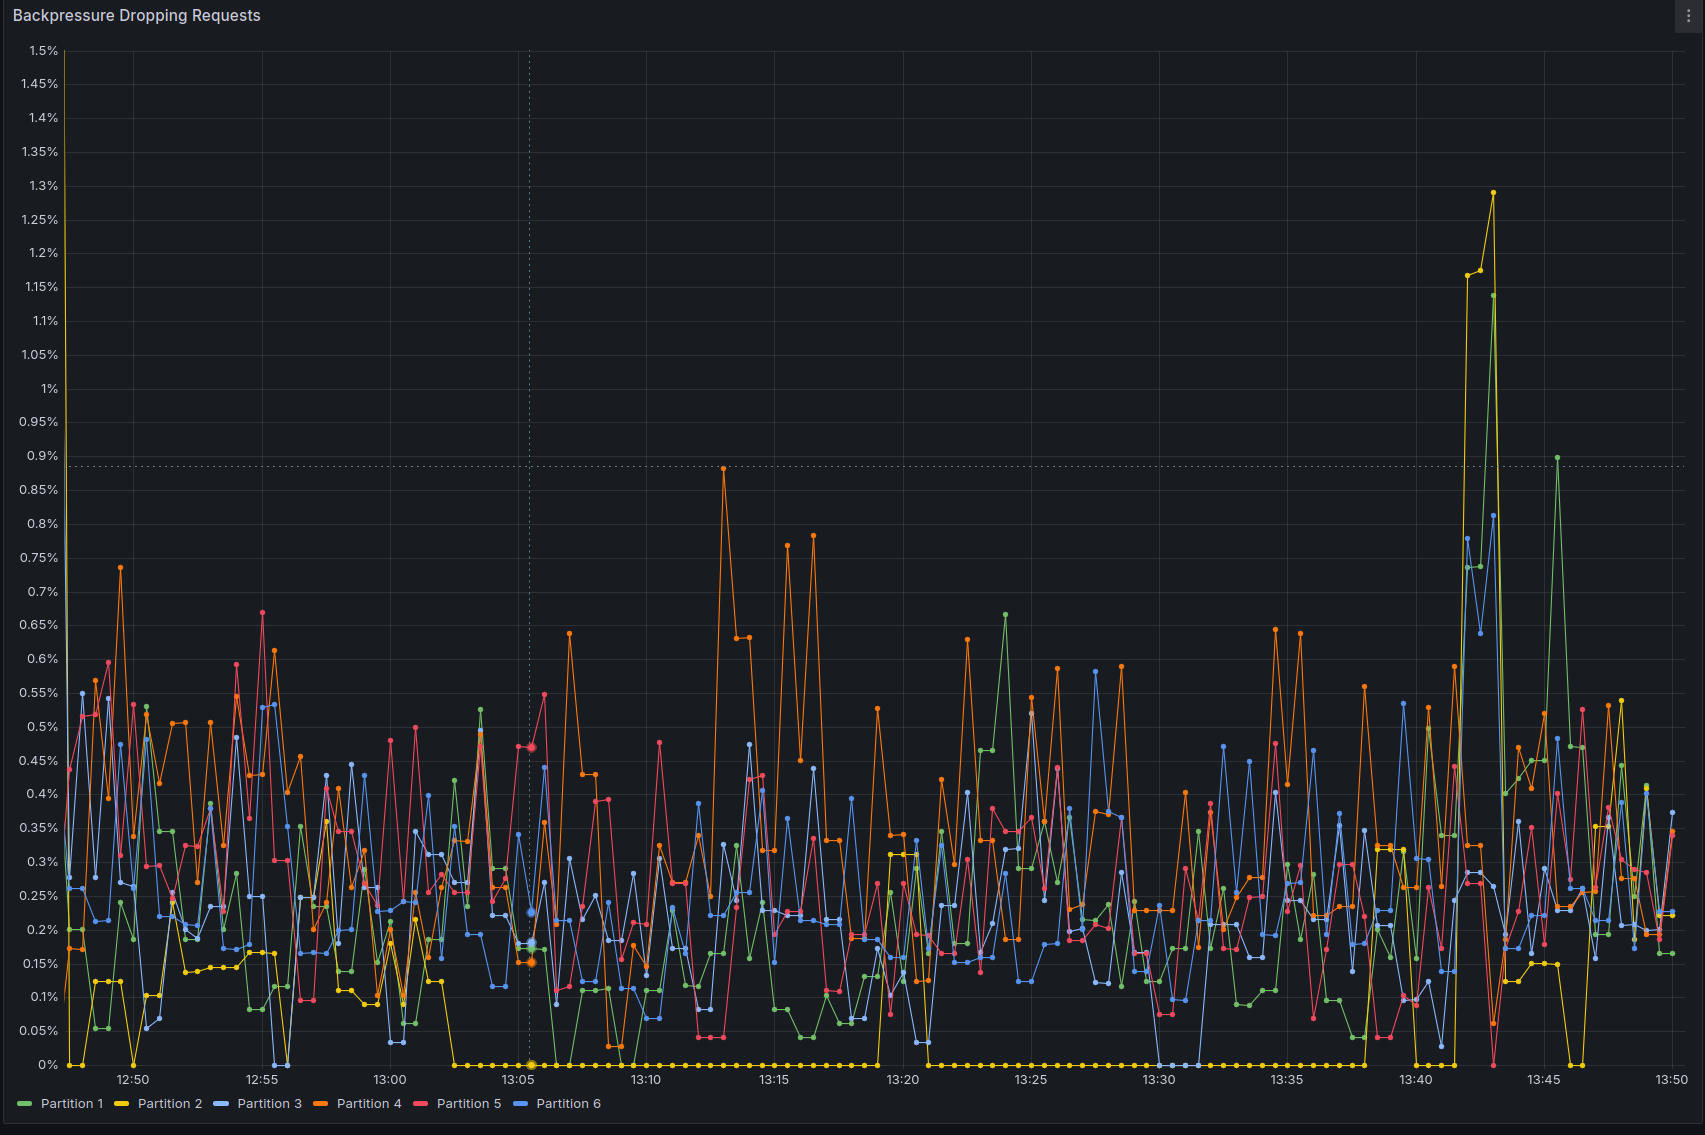
- Backpressure is now constantly above zero, even if it's just 0.5%, it's a sign that we are reaching the throughput limits.
Second part of the benchmark: scaling to 6 brokers and 6 partitions
With 240 process instances per second being spawned, we send the commands to scale the cluster.
We first scale the zeebe statefulset to 6 brokers. As soon as the new brokers are running, even before they are healthy,
we can send the command to include them in the cluster and to increase the number of partition to 6.
This can be done following the guide in the official docs.
Once the scaling has been completed, as can be seen from the Cluster operation section in the dashboard, we see the newly created
partitions participate in the workload.
We now have the following topology:
As we did before, let's start increasing the load incrementally as we did with the other cluster configuration.
| Time | Brokers | Partitions | Throughput | CPU Usage | Throttling (CPU) | Backpressure | Notes |
|---|
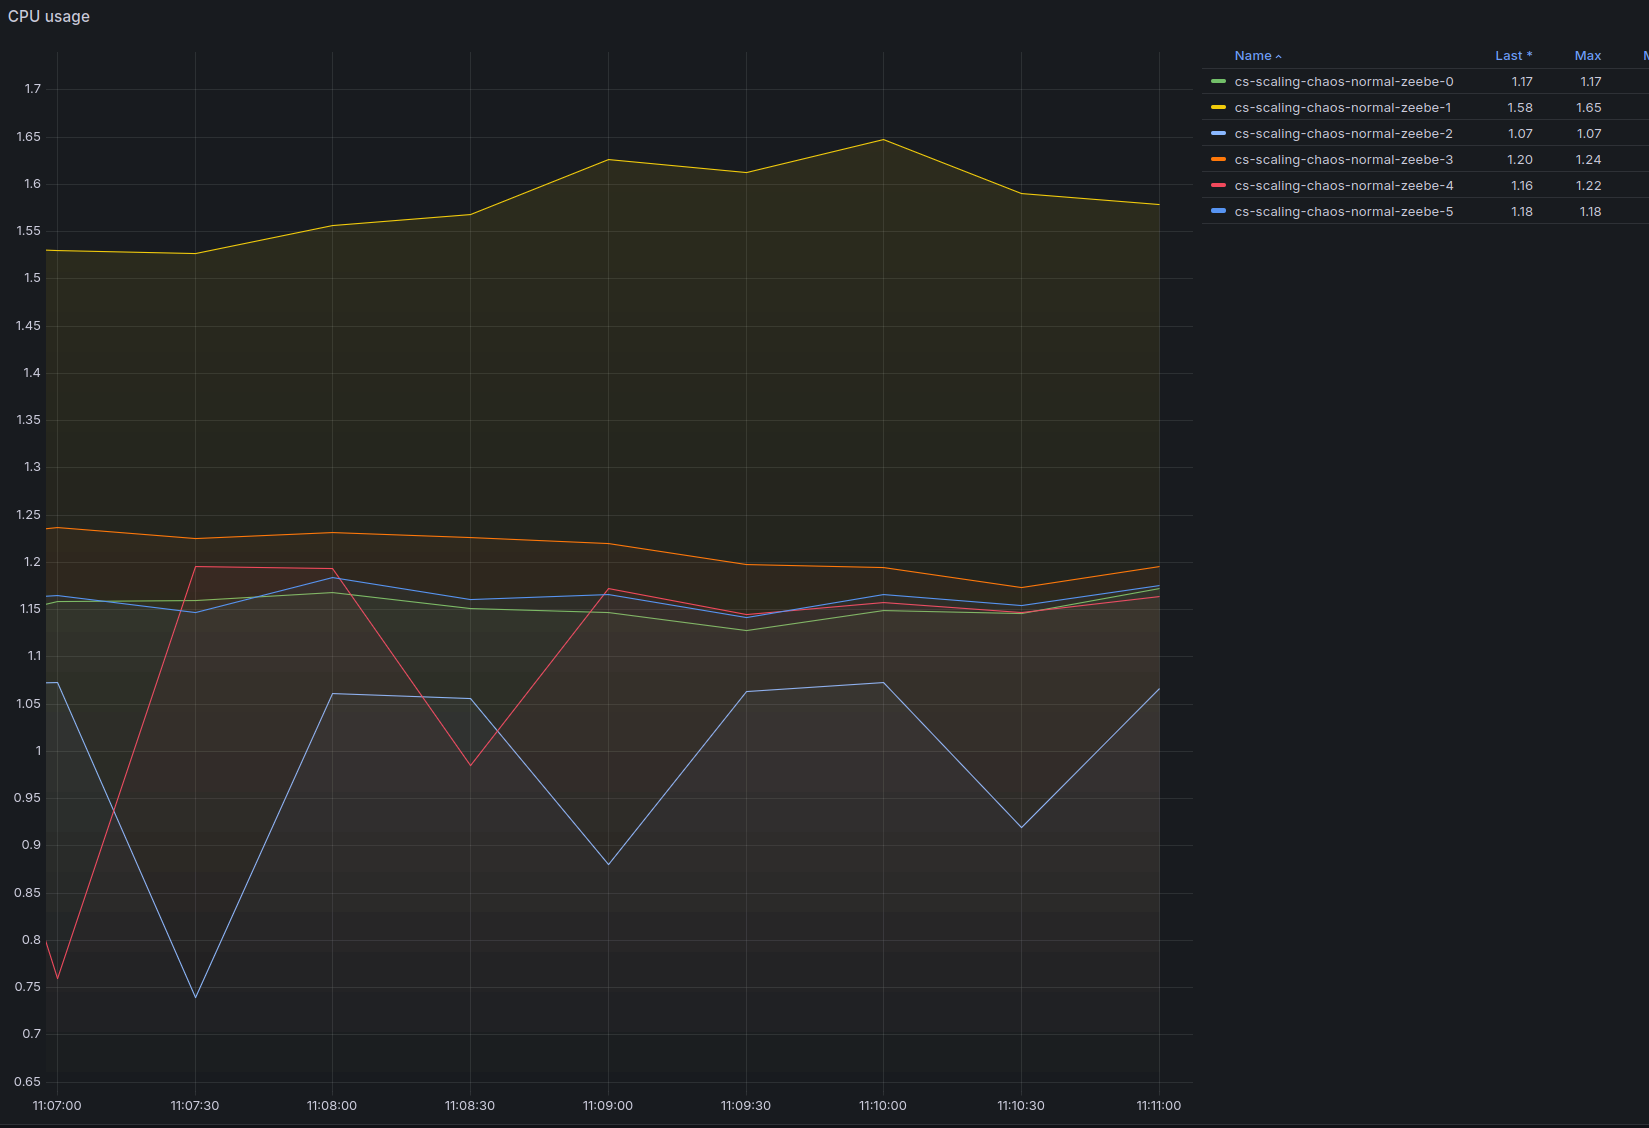
| 10:27 | 6 | 6 | 240 PI/s | 0.92/1.26/0.74/0.94/0.93/0.93 | 2.8/6.0/0.3/2.8/3.4/3.18 | 0 | After scale up |
| 11:05 | 6 | 6 | 300 PI/s | 1.17/1.56/1.06/1.23/1.19/1.18 | 9%/29%/0.6%/9%/11%/10% | 0 | Stable |
| 11:10 | 6 | 6 | 360 PI/s | 1.39/1.76/1.26/1.43/1.37/1.42 | 19%/42%/2%/16%/21%/22% | 0 | Stable |
| 11:10 | 6 | 6 | 420 PI/s | 1.76/1.89/1.50/1.72/1.50/1.70 | 76%/84%/52%/71%/60%/65% | 0 (spurts on 1 partition) | Pushing hard |
However, at 11:32 one of the workers restarted, causing a spike in the processing due to jobs being yielded back to the engine, less jobs to be activated,
and thus less to be completed. This caused a job backlog to build up in the engine. Once the worker restarted, the backlog was drained, leading to a spike in
job completion requests: around 820 req/s, as opposed to the expected 420 req/s.
Because of this extra load, the cluster started to consume even more CPU, resulting in heavy CPU throttling from the cloud provider.
On top of this, eventually a broker restarted (most likely as we run on spot VMs). In order to continue with our test, we scaled the load down to 60 PI/s
to give the cluster the time to heal.
Once the cluster was healthy again, we raised the throughput back to 480 PI/s to verify the scalability with twice as much throughput as the initial configuration.
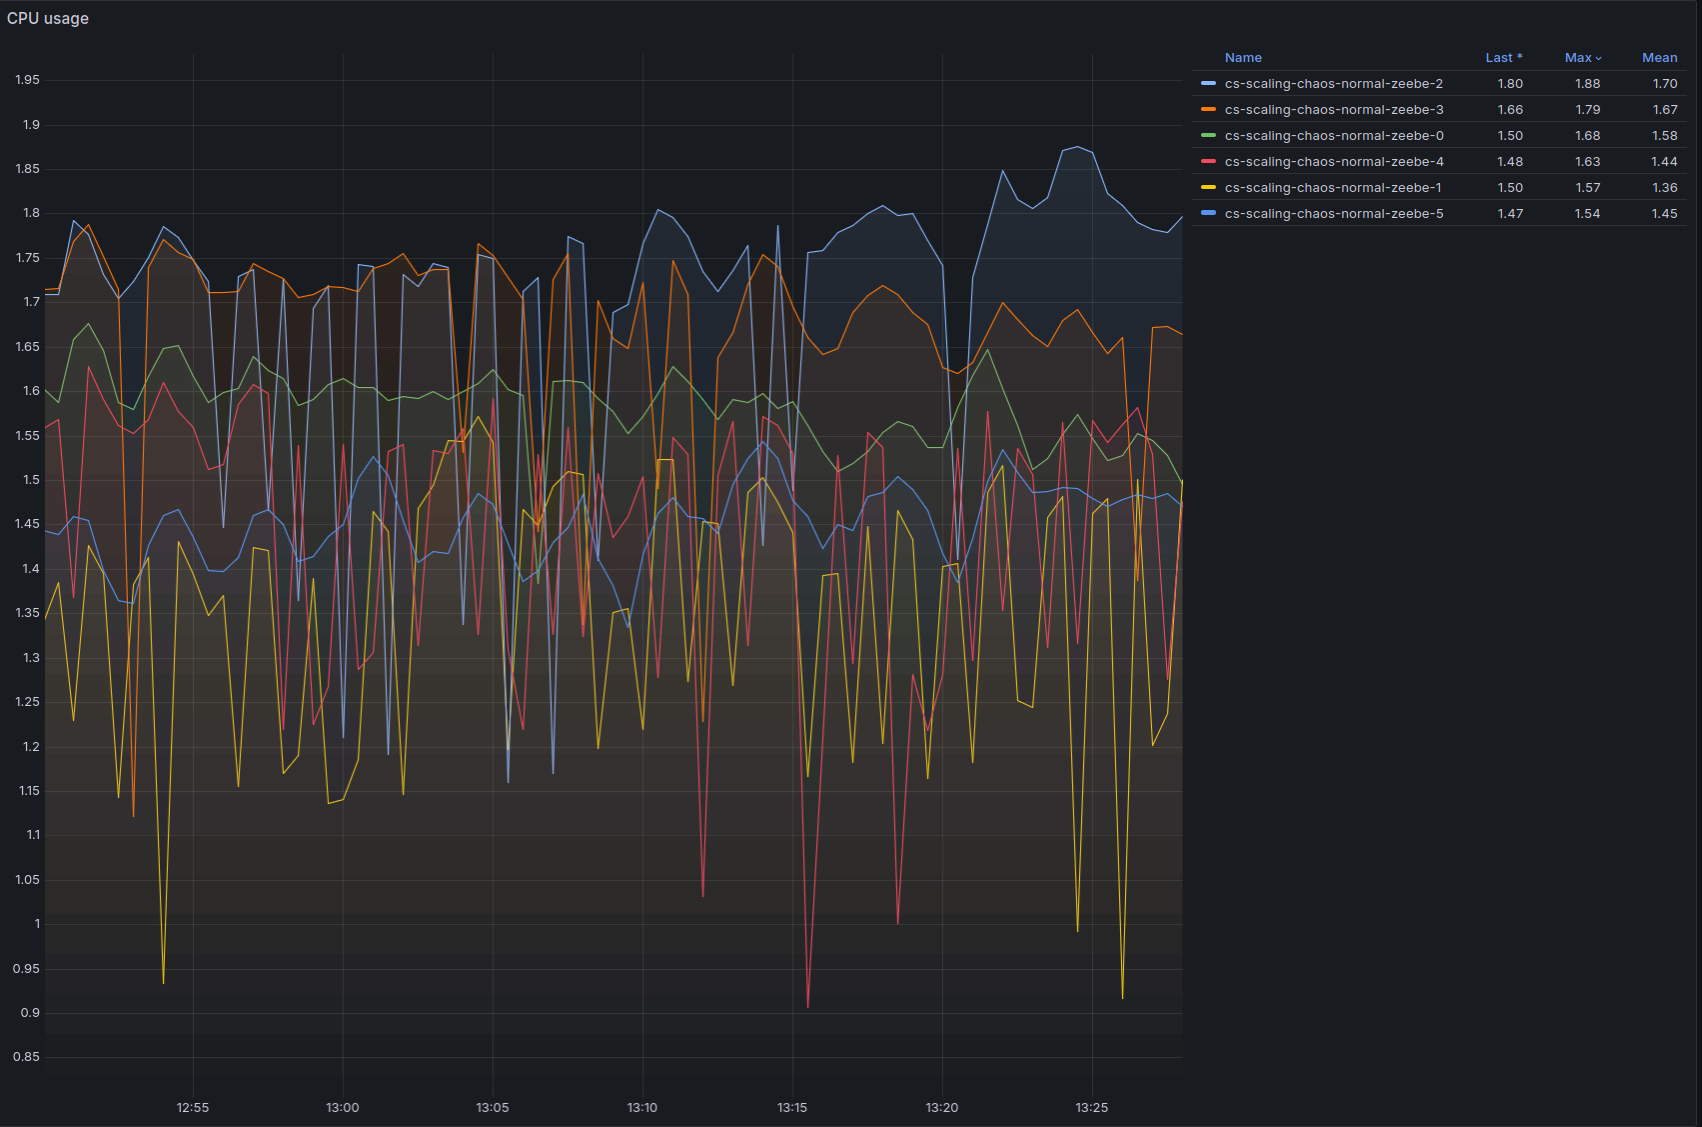
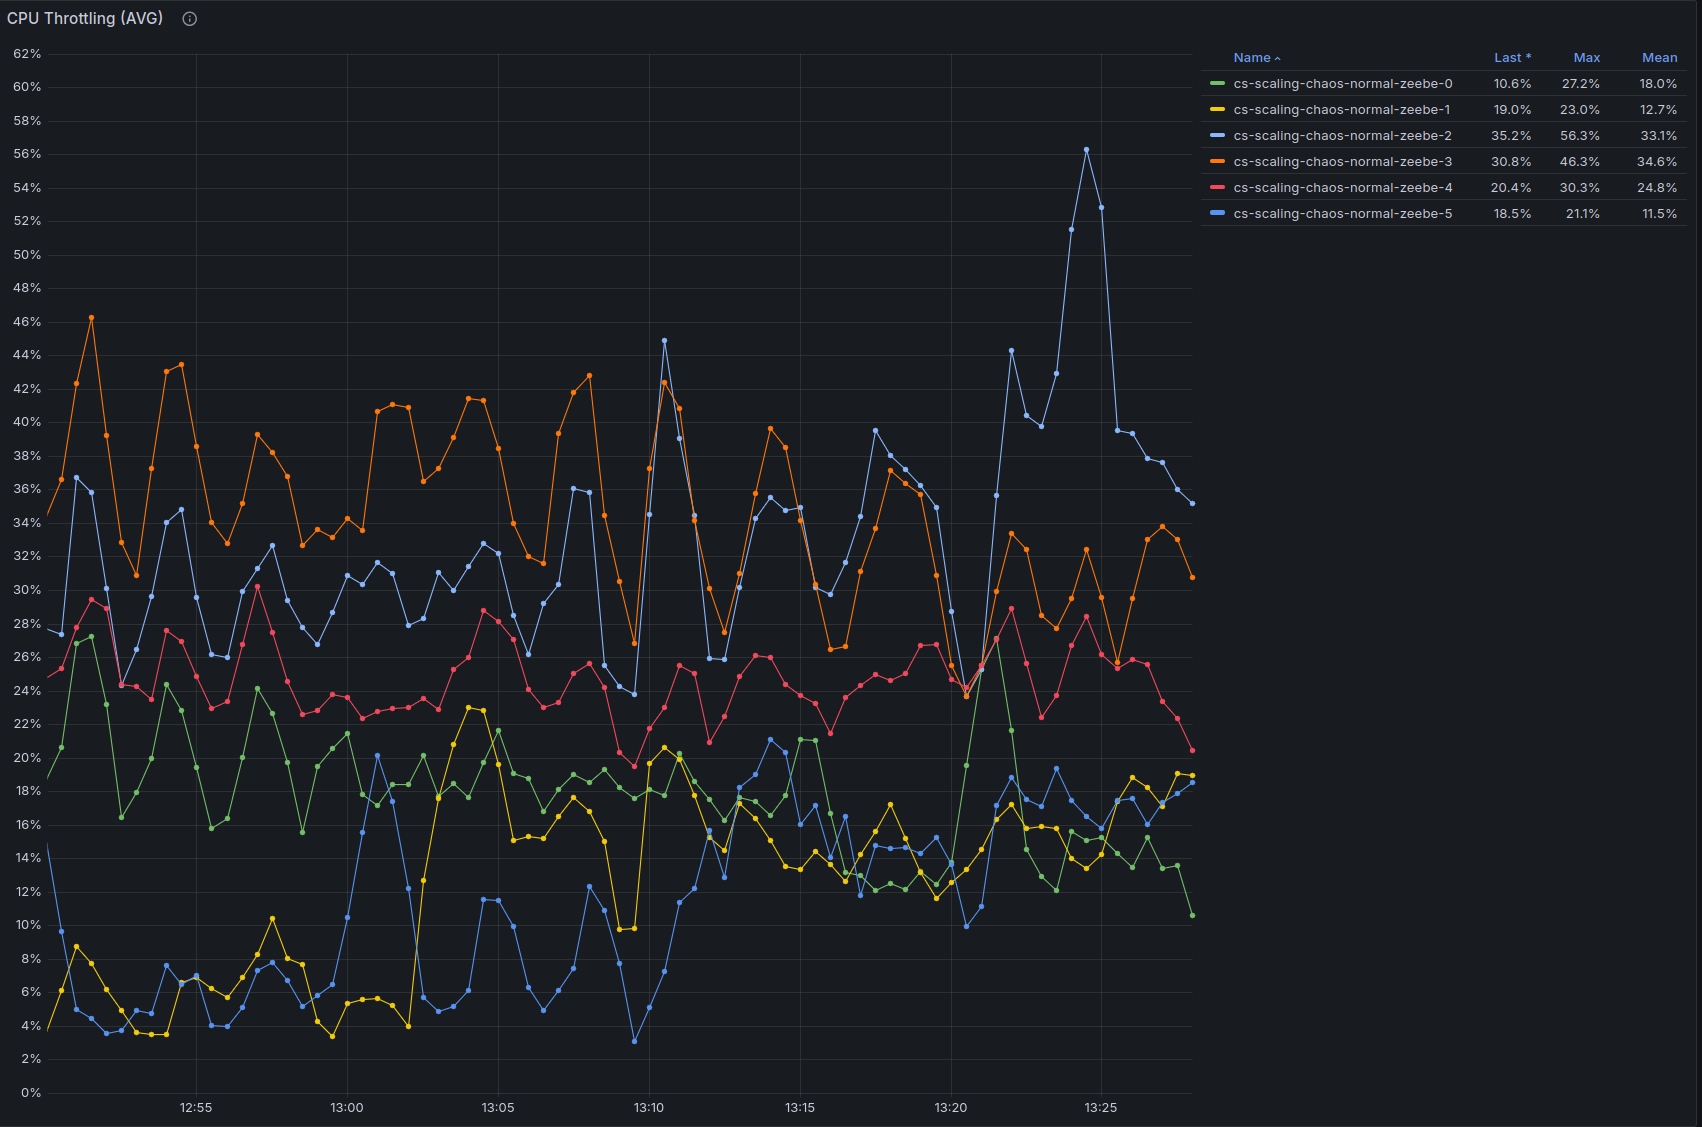
The cluster was able to sustain 480 process instances per second with similar levels of backpressure of the initial configuration:
We can see below that CPU usage is high, and there is still some throttling, indicating we might be able to do more with a little bit of vertical scaling, or by scaling out and reducing the number of partitions per broker:
Conclusion
We were able to verify that the cluster can scale almost linearly with new brokers and partitions, so long as the other components, like the secondary storage, workers, connectors, etc., are able to sustain a similar.
In particular, making sure that the secondary storage is able to keep up with the throughput turned out to be crucial to keep the cluster stable in order to
avoid filling up the Zeebe disks, which would bring to a halt the cluster.
We encountered a similar issue when one worker restarts: initially it creates a backlog of unhandled jobs, which turns into a massive increase in requests per second when the worker comes back, as it starts activating jobs faster than the cluster can complete them.
Finally, with this specific test, it would be interesting to explore the limits of vertical scalability, as we often saw CPU throttling being a major blocker for processing. This would make for an interesting future experiment.