REST API: From ForkJoin to a Dedicated Thread Pool

During the latest REST API Performance load tests, we discovered that REST API requests suffered from significantly higher latency under CPU pressure, even when throughput numbers looked comparable. While adding more CPU cores alleviated the issue, this wasn’t a sustainable solution — it hinted at an inefficiency in how REST handled broker responses. See related section from the previous blog post.
This blog post is about how we diagnosed the issue, what we found, and the fix we introduced in PR #36517 to close the performance gap.
The Problem
A difference we spotted early between REST API and gRPC request handling was the usage of the BrokerClient:
- gRPC:
BrokerClientcalls are wrapped with retries and handled directly in the request thread. - REST: requests are executed without retries, and responses are handled asynchronously using the common
ForkJoinPool.
On clusters with 2 CPUs, the JVM defaults to a single thread for the common ForkJoinPool.
Our expectation was that this could cause contention: one thread might not be fast enough to process responses in time, leading to delays in the Gateway ↔ Broker request-response cycle.
The Solution Journey
Solving this issue wasn’t a straight line — we tried a few approaches before landing on the final design. Each iteration gave us valuable insights about Java’s thread pool usage and its impact on REST API performance.
1. First Attempt: SynchronousQueue
We began with a custom ThreadPoolExecutor that used a SynchronousQueue for task handoff:
new ThreadPoolExecutor(
    corePoolSize,
    maxPoolSize,
    keepAliveSeconds,
    TimeUnit.SECONDS,
    new SynchronousQueue<>(),
    threadFactory,
    new ThreadPoolExecutor.CallerRunsPolicy());
A SynchronousQueue has no capacity — each task submission must immediately find a free worker thread.
If no thread is available, the caller blocks until one frees up.
In practice, this meant concurrency was artificially limited: bursts of REST requests had to wait for a thread to become available, reducing parallelism. The results were modest:
- Request rate: unchanged
- Average latency: improved slightly (from ~120 ms → ~100 ms)
- CPU throttling: dropped only marginally (100% → 90%)
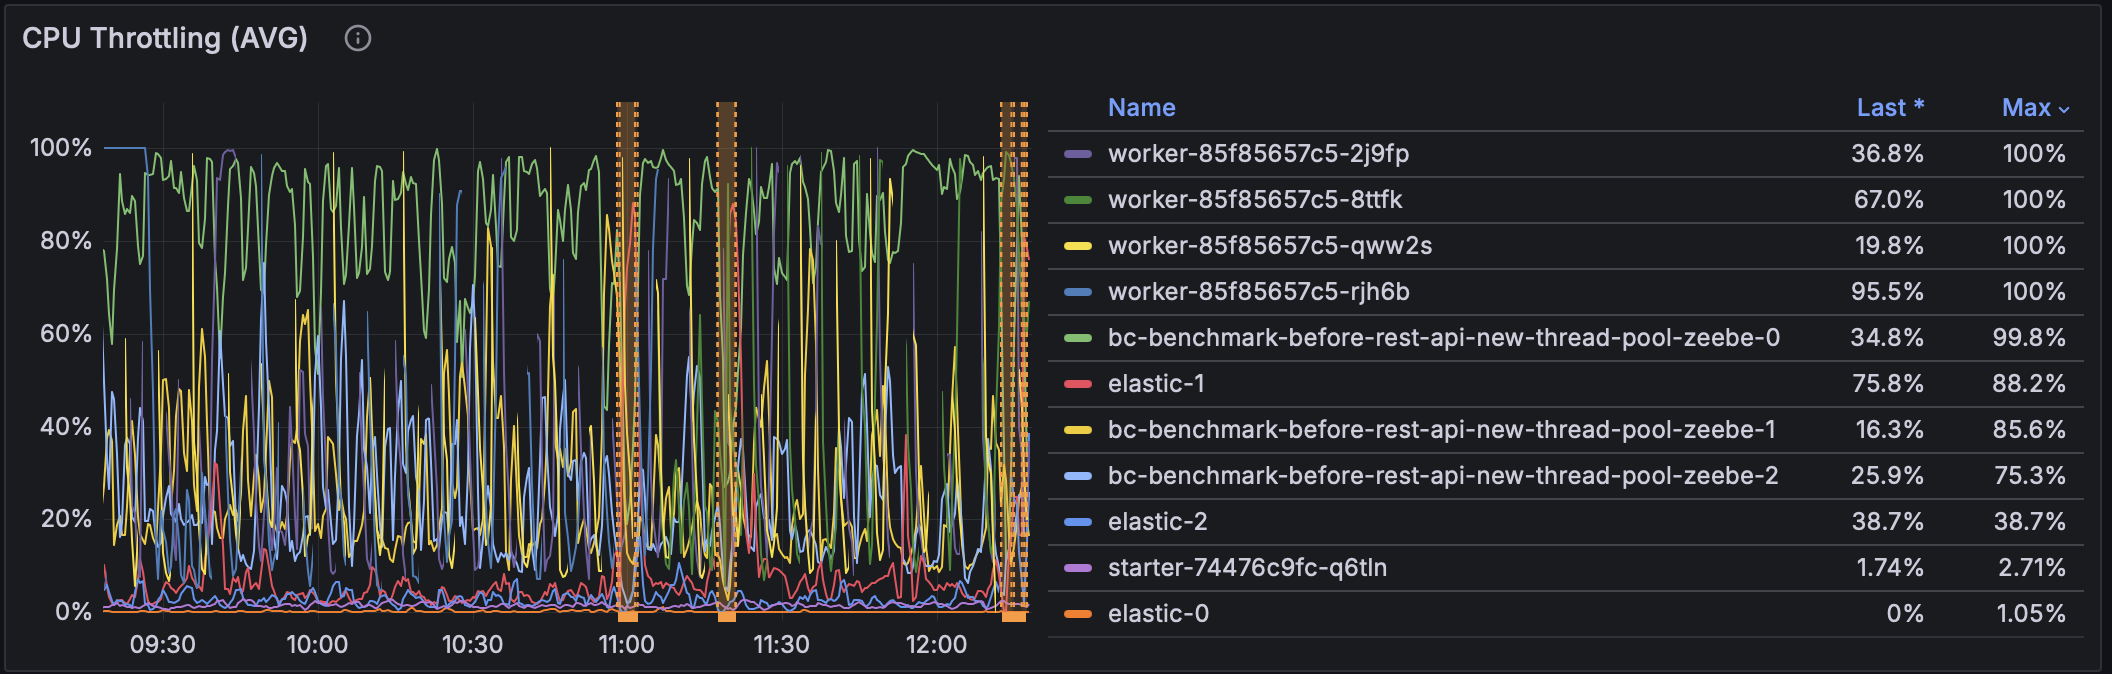
Before any changes introduced, results looked like this:
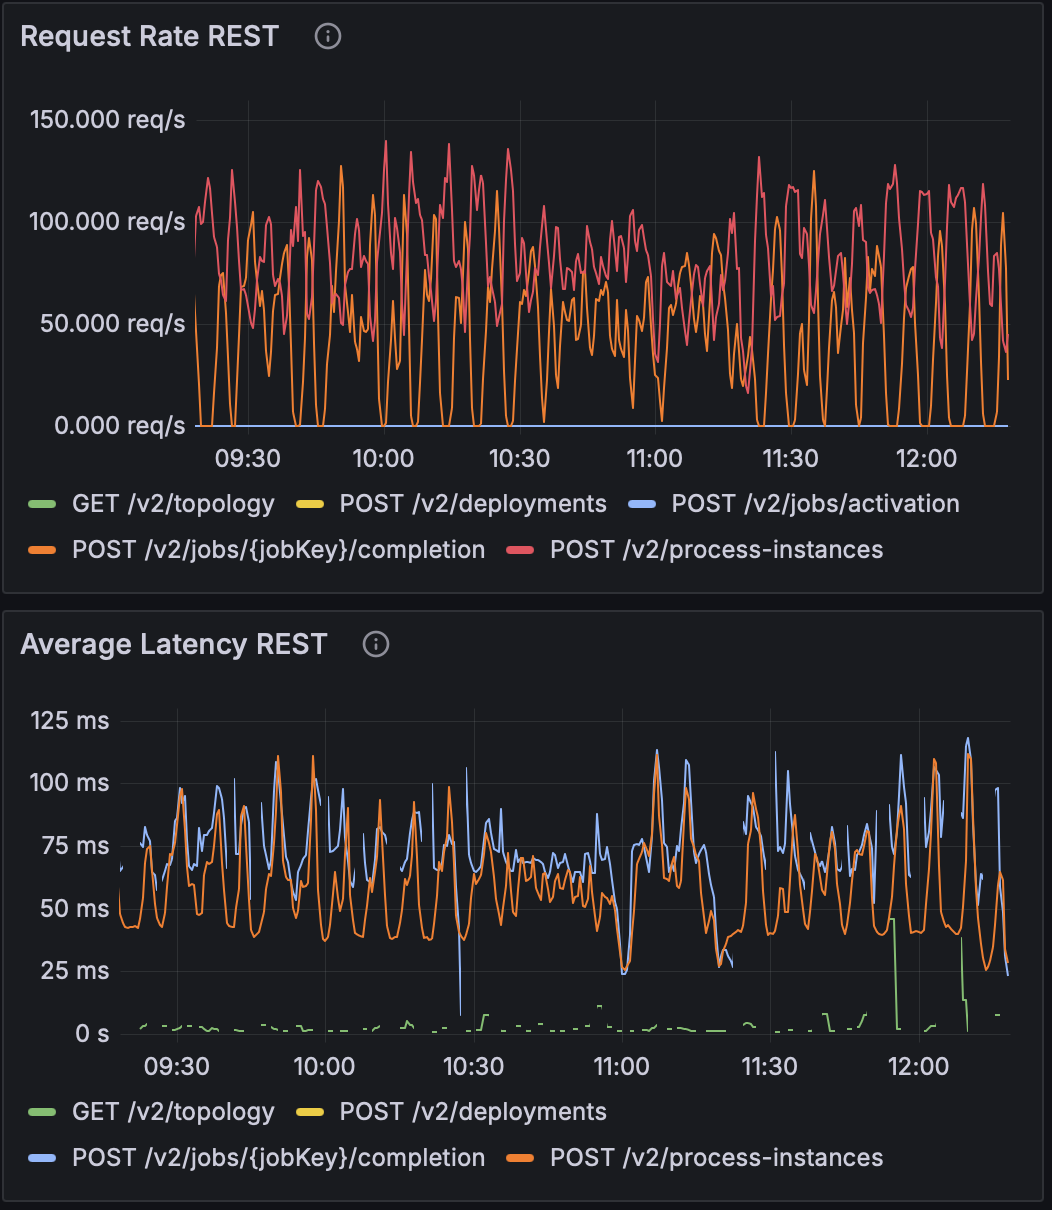
Then we started benchmarking after introducing executor with SynchronousQueue:
This hinted we were on the right track — a dedicated executor helped — but the queue strategy was too restrictive.
2. Experiment: ArrayBlockingQueue + AbortPolicy
Next, we switched to an ArrayBlockingQueue with a capacity of 64.
This allowed the pool to buffer short micro-bursts of requests instead of blocking immediately.
At the same time, we replaced CallerRunsPolicy with AbortPolicy:
new ThreadPoolExecutor.AbortPolicy();
The idea was to fail fast on saturation: if the queue filled up and no thread was free, the executor would throw RejectedExecutionException immediately.
This boosted the measured request rate, but at a cost:
- Many requests were simply rejected outright.
- Measuring true performance became tricky, since high throughput numbers hid the rejections.
- Operationally, this wasn’t acceptable — REST clients would constantly see errors under load.
Because of this, we abandoned the fail-fast approach.
3. Final Decision: CallerRunsPolicy + Higher Max Pool Size
Finally, we returned to CallerRunsPolicy.
Instead of rejecting tasks, this policy makes the caller thread execute the task itself when the pool is saturated.
This introduces natural backpressure: clients slow down automatically when the system is busy, without dropping requests.
To give the executor more headroom, we also increased the maximum pool size from availableProcessors * 2 to availableProcessors * 8.
This combination made the breakthrough:
- Request rate (REST): stabilized around 150 RPS with spikes up to 200 RPS
- Average latency: dropped dramatically (from ~120 ms → ~25 ms)
- CPU throttling: reduced significantly (100% → 30-40%)
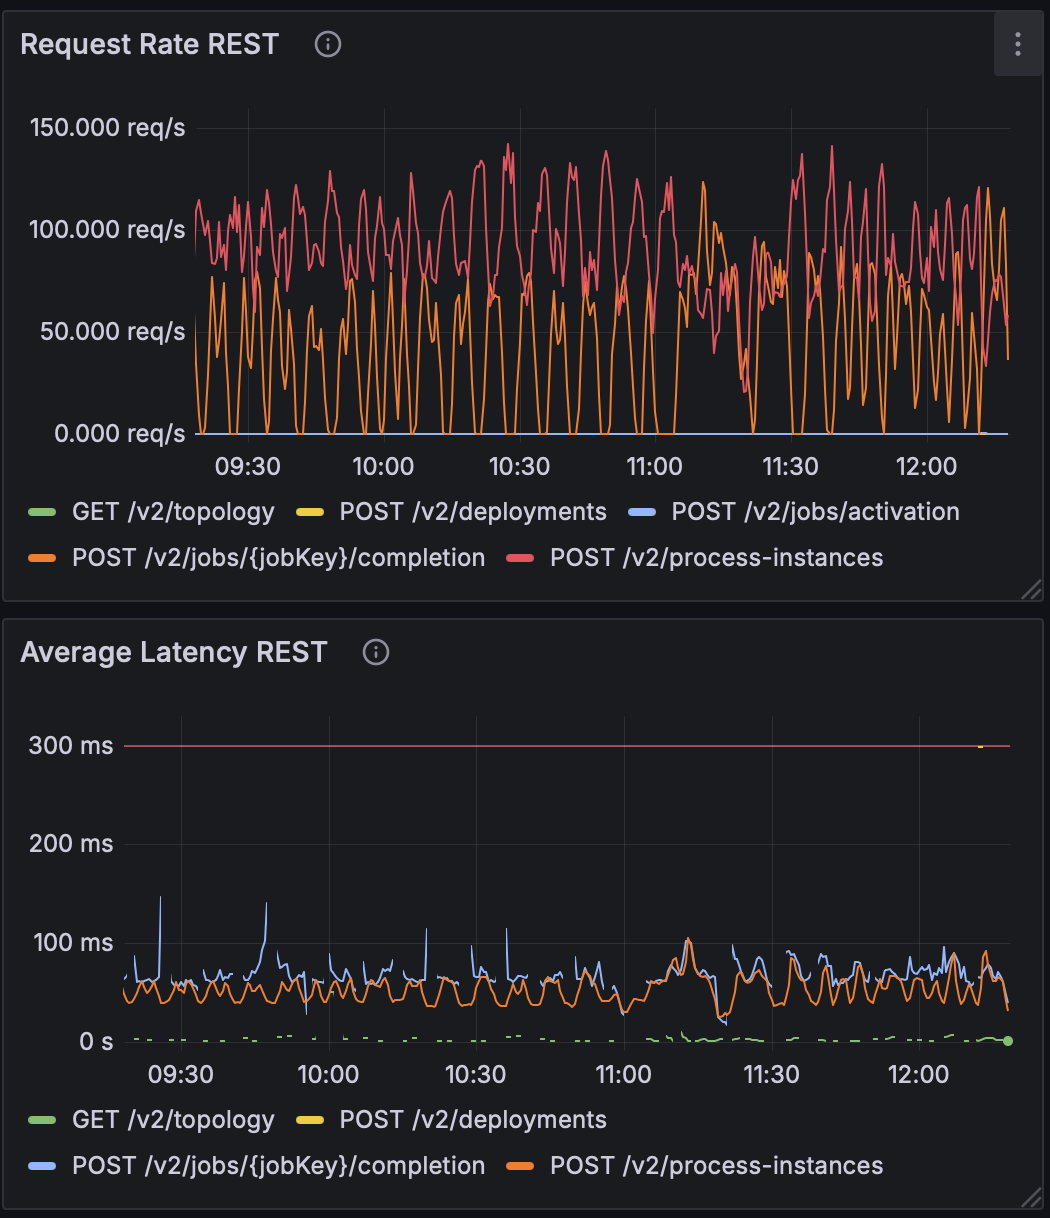
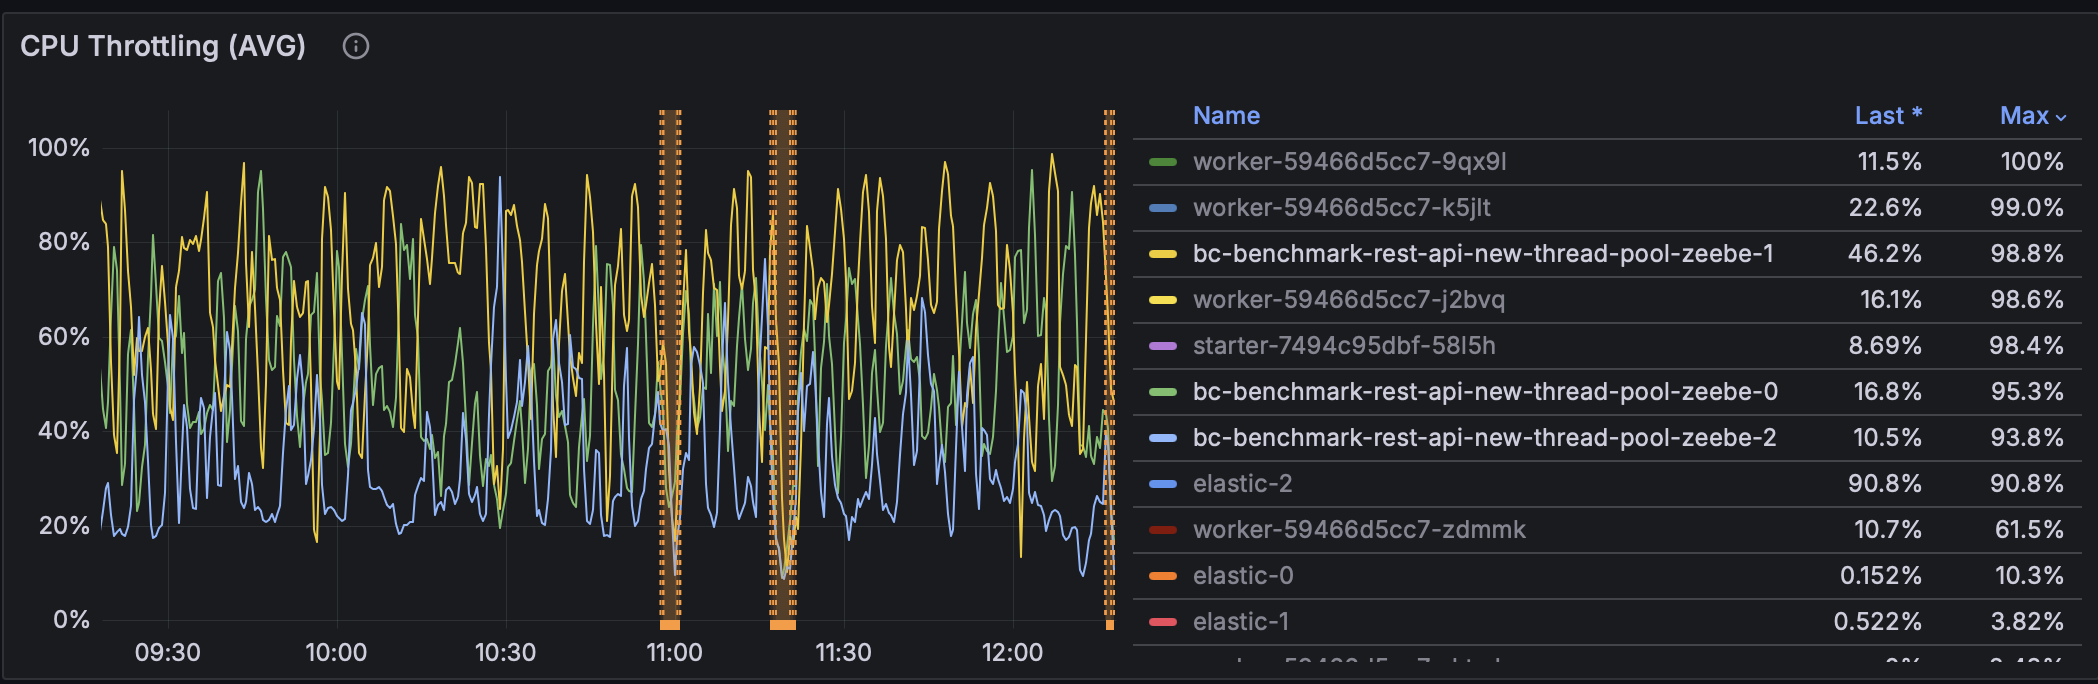
Here are the final results:

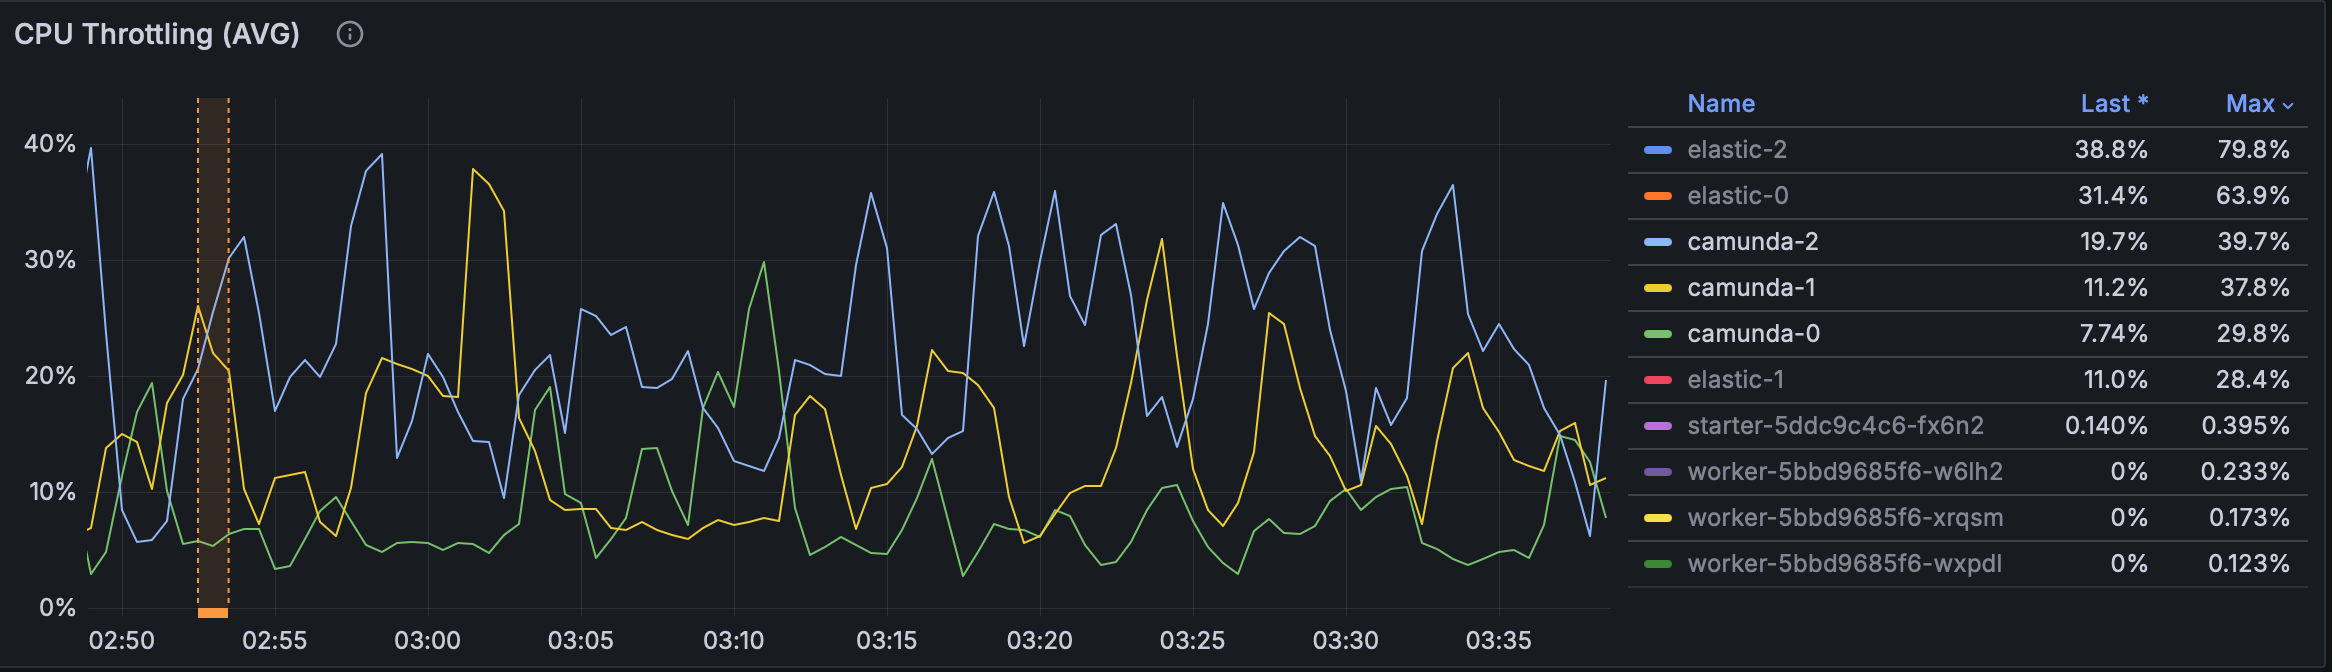
This design struck the right balance: elastic concurrency, backpressure, and resource efficiency.
Key Takeaways
- SynchronousQueue limits concurrency — good for handoff semantics, but too restrictive for REST workloads.
- Fail-fast rejection looks good in benchmarks but fails in production — clients can’t handle widespread request errors.
- CallerRunsPolicy provides natural backpressure — throughput stabilizes without dropping requests, and latency improves.
- CPU-aware max pool sizing matters — scaling pool size relative to cores unlocks performance gains.
More Benchmarking
To validate that our executor change holds up across configurations, we ran extra tests on our benchmark cluster provisioned with 2 vCPUs per Camunda application.
1) Comparing Max Pool Size (×4, ×8, ×16)
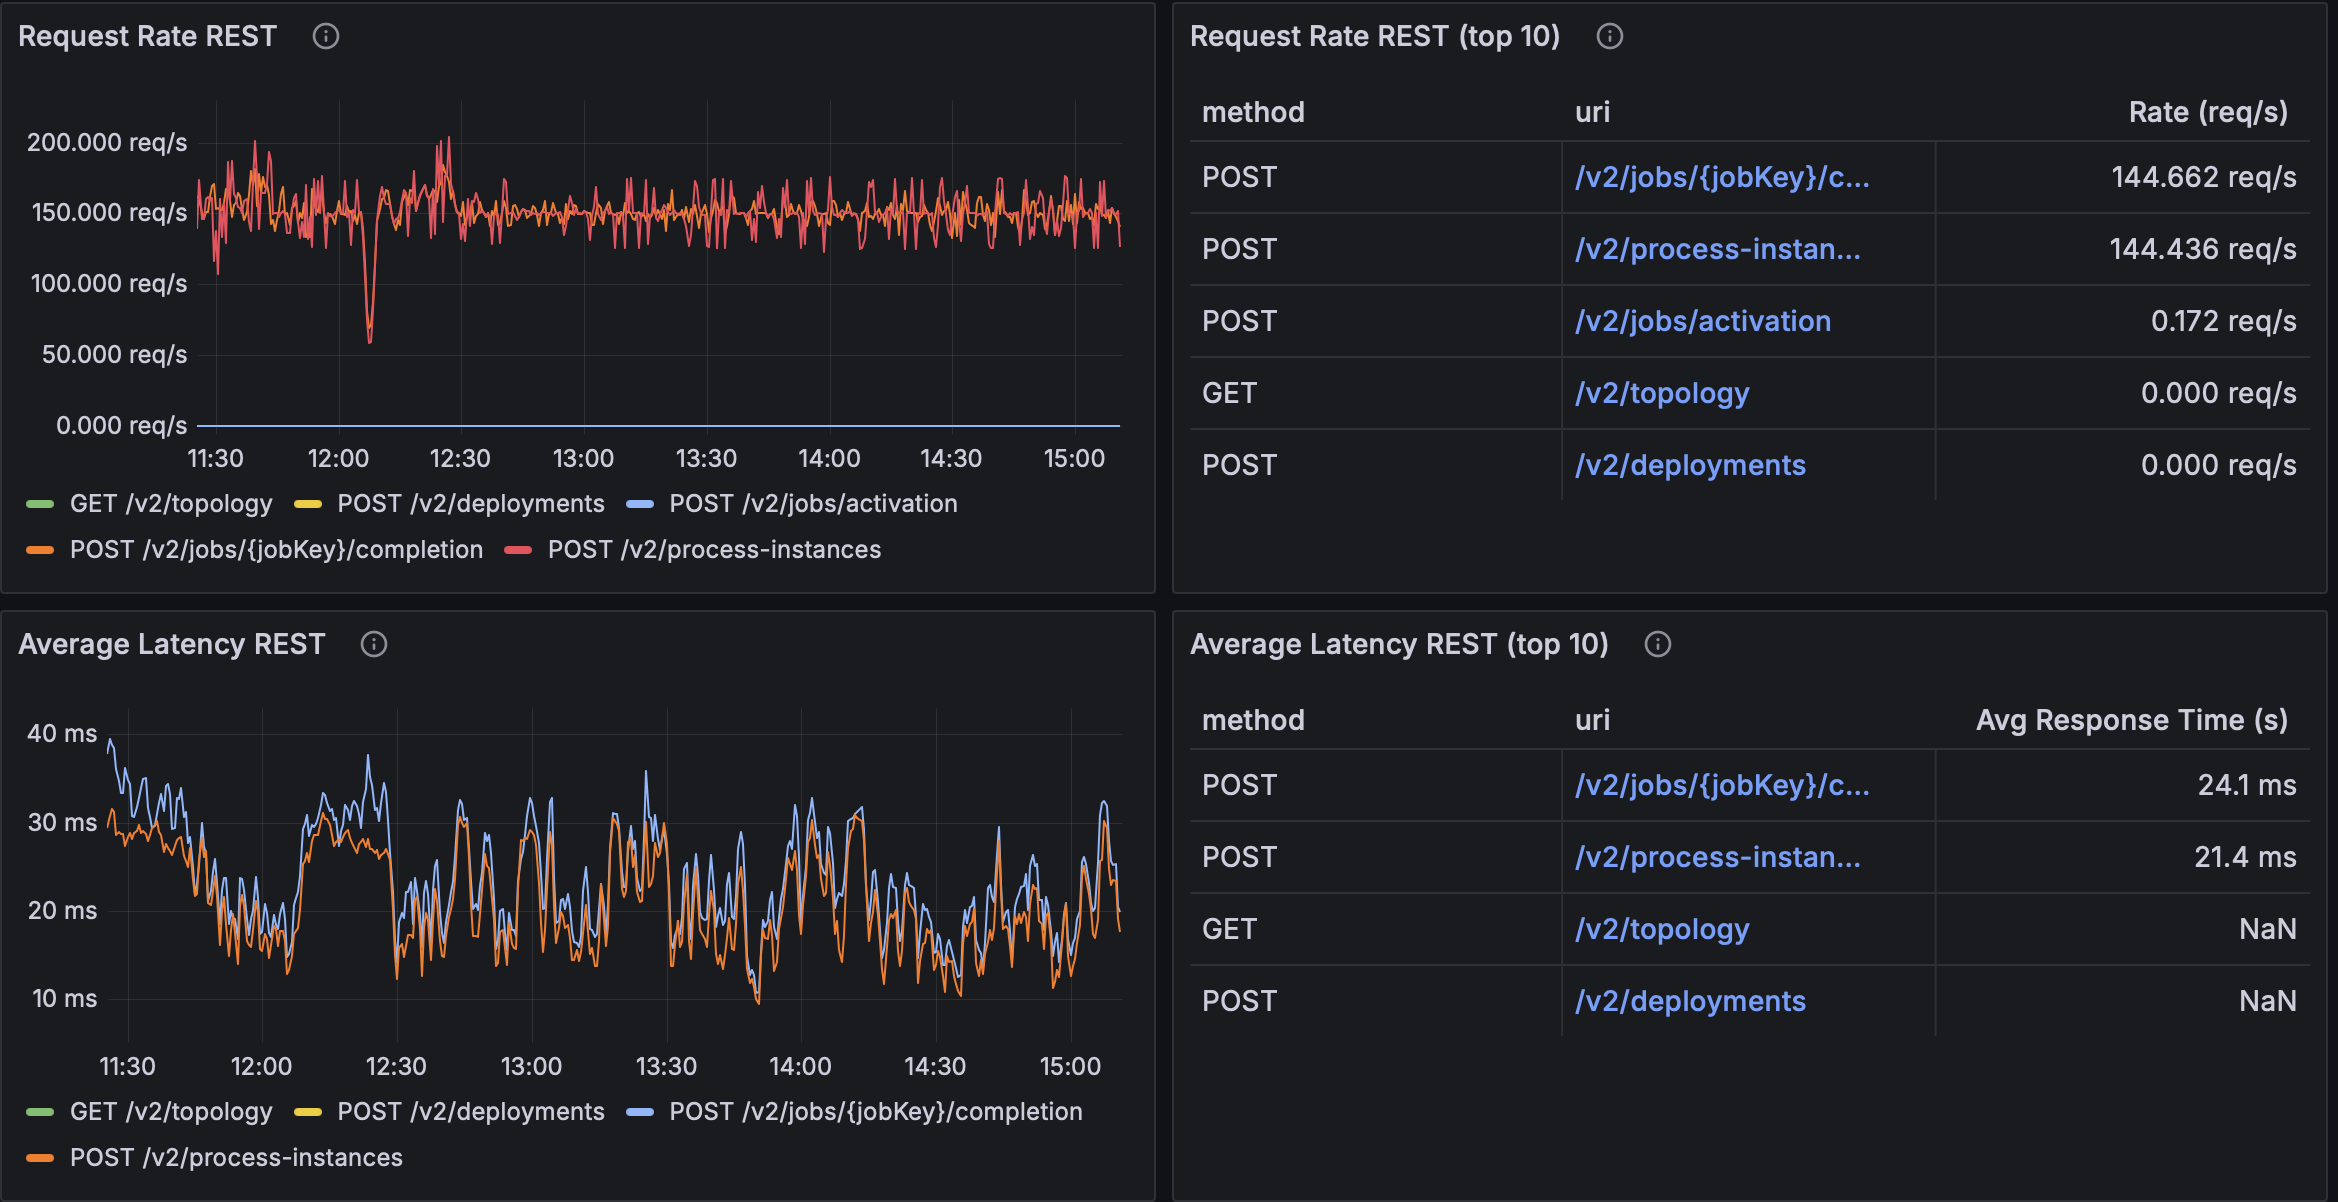
We ran the same workload while varying maxPoolSize = availableProcessors × {4, 8, 16}. Below are the observed tops from Grafana panels in the screenshots:
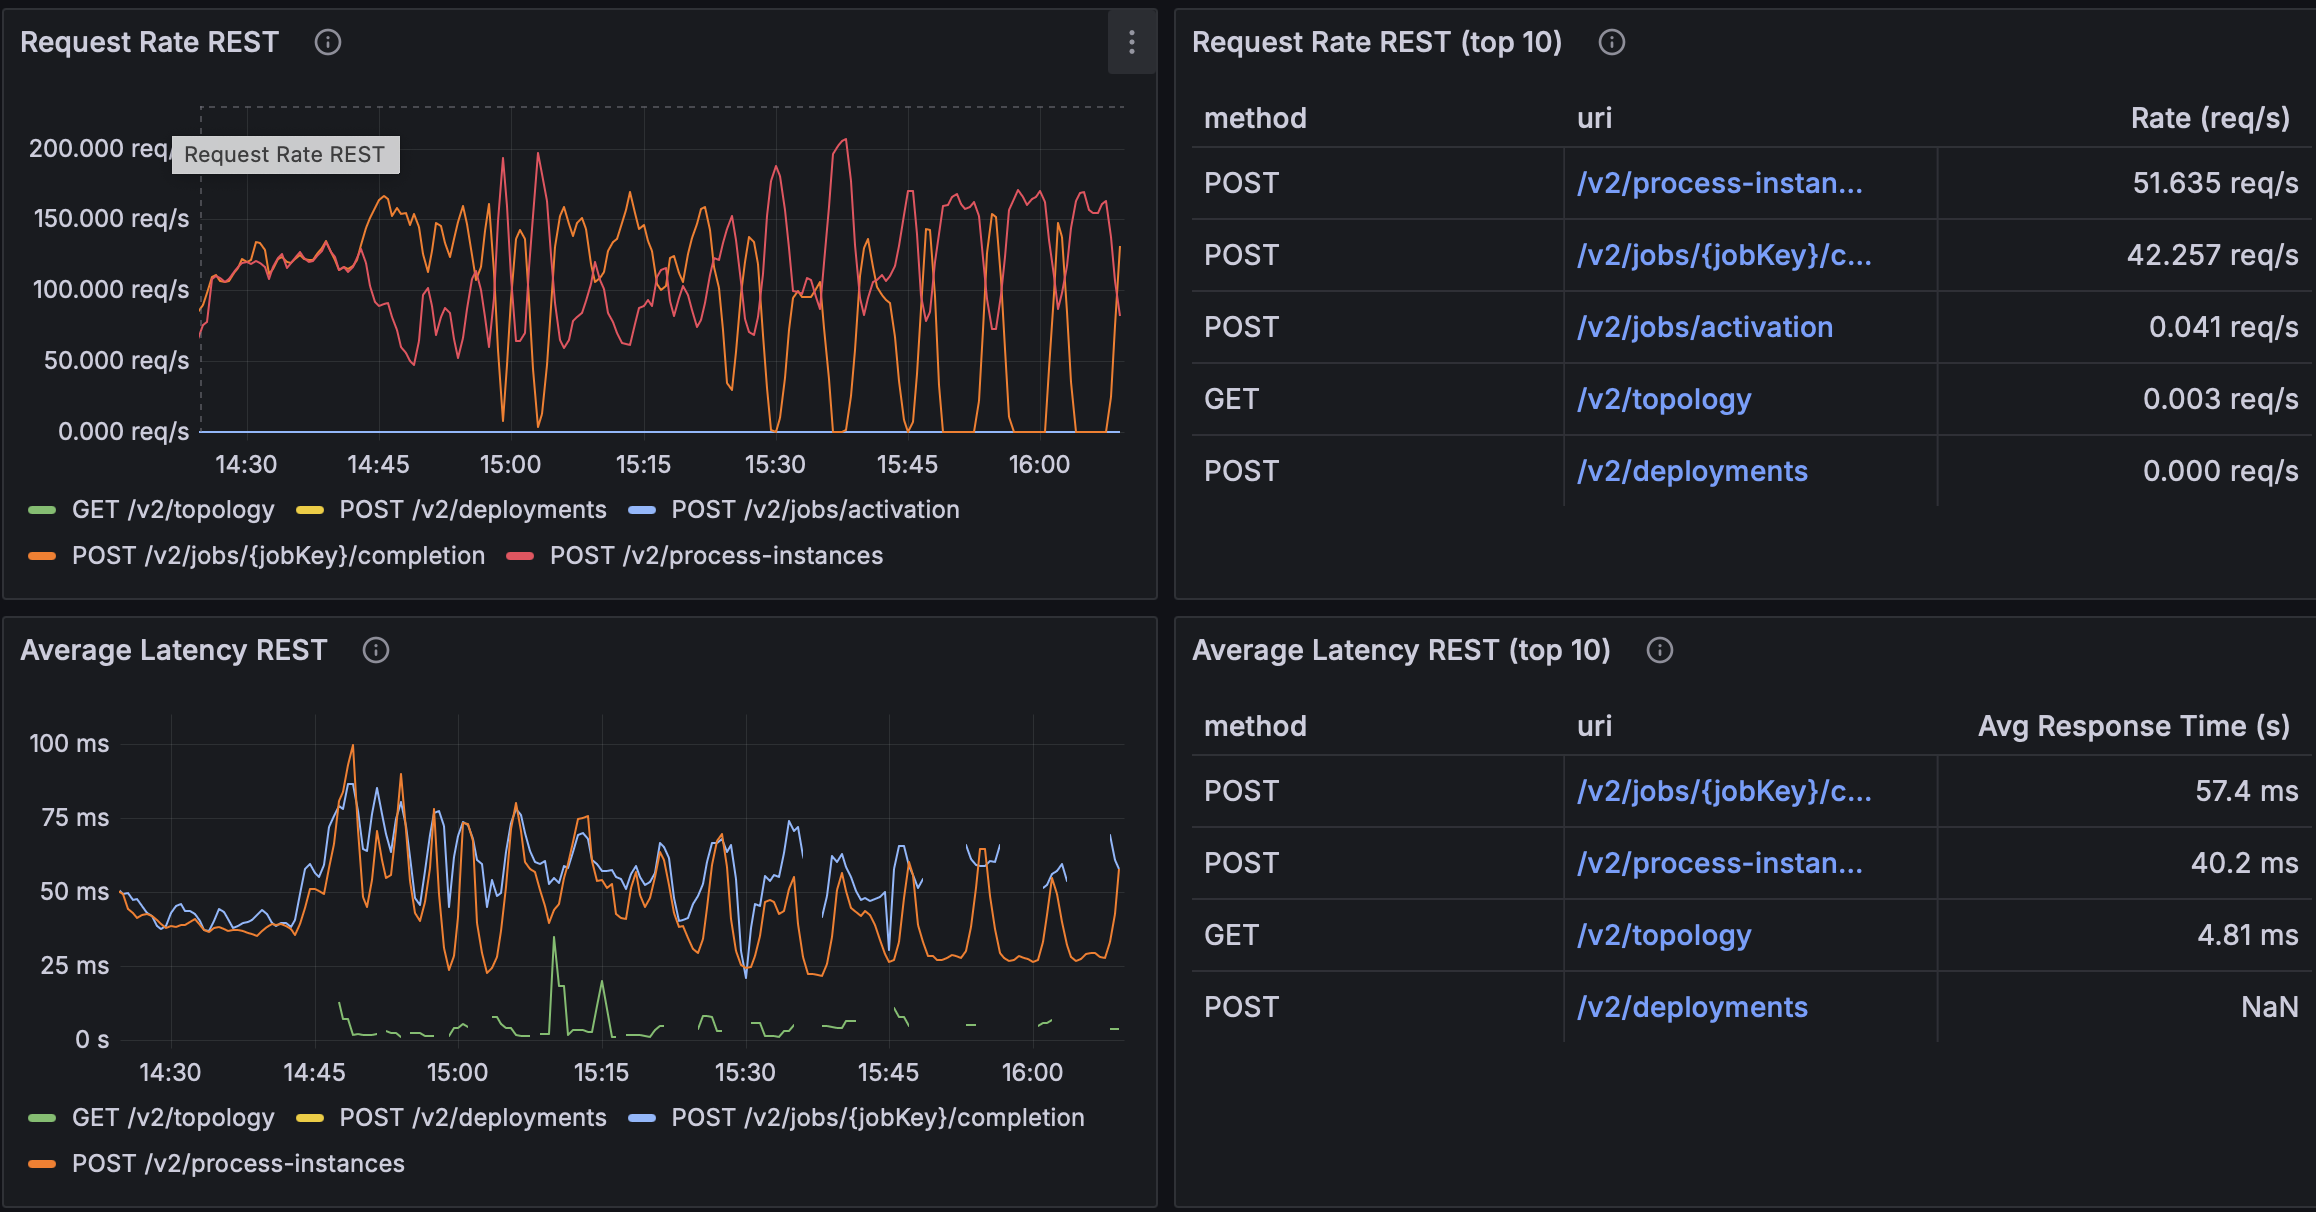
maxPoolSizeMultiplier=4
maxPoolSizeMultiplier=8

maxPoolSizeMultiplier=16
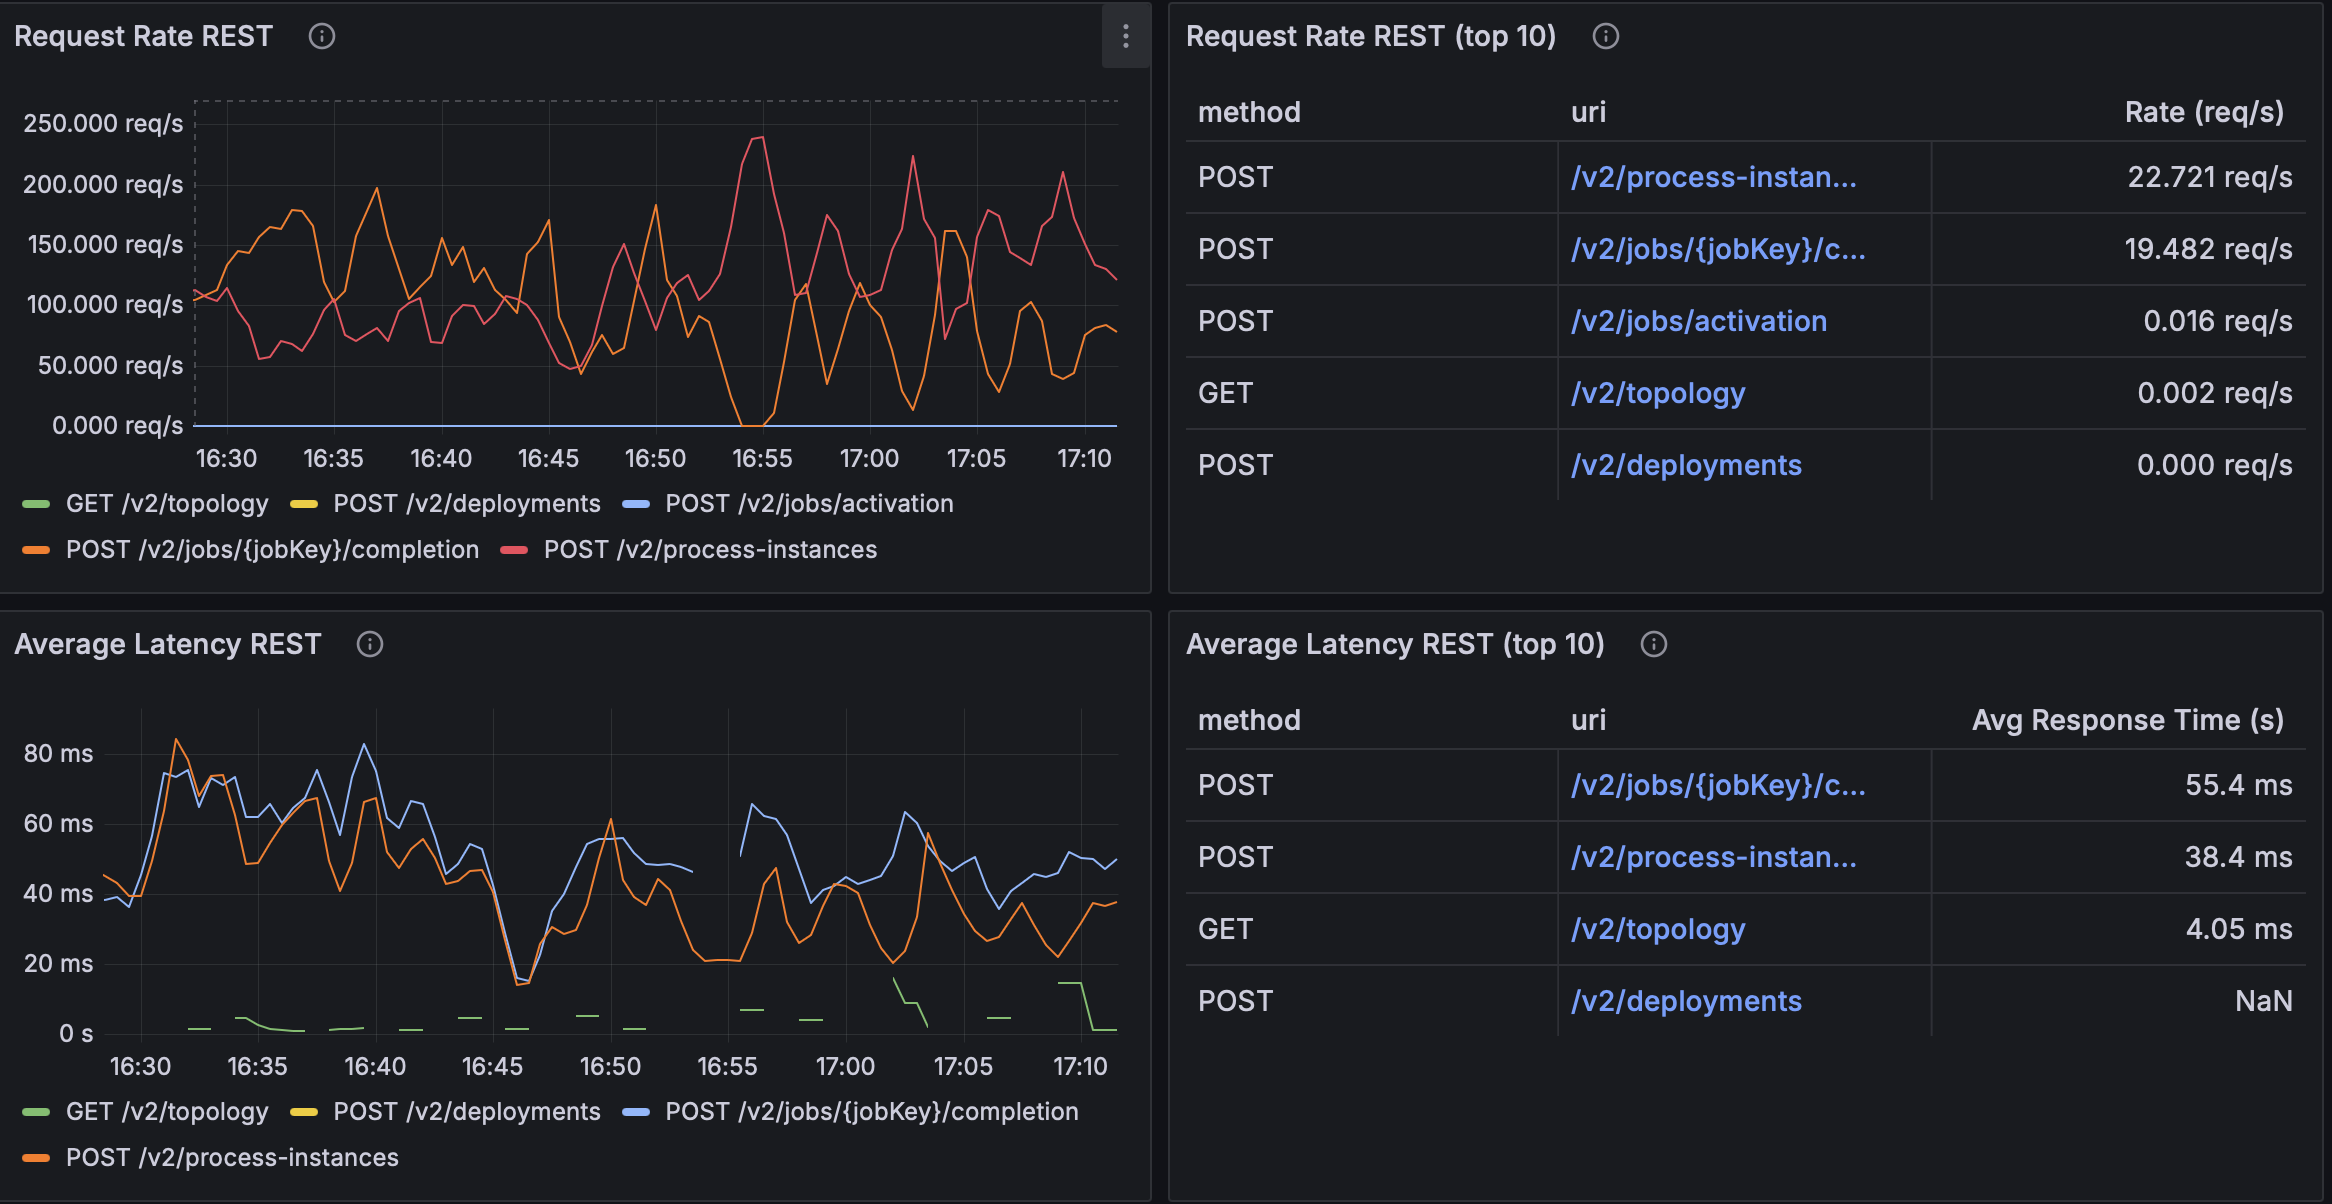
| Multiplier | Request Rate (proc-instances) | Request Rate (completion) | Avg Latency (proc-instances) | Avg Latency (completion) |
|---|---|---|---|---|
| ×4 | ~51.6 req/s | ~42.3 req/s | ~40.2 ms | ~57.4 ms |
| ×8 | ~144.4 req/s | ~144.7 req/s | ~21.4 ms | ~24.1 ms |
| ×16 | ~22.7 req/s | ~19.5 req/s | ~38.4 ms | ~55.4 ms |
What this suggests (in our setup):
- ×8 is the clear sweet spot: highest sustained throughput with the lowest average latencies.
- ×4 under-provisions the pool (lower RPS, higher latency).
- ×16 shows diminishing/negative returns (likely scheduler contention or oversubscription): much lower RPS and latencies drifting back up.
Takeaway: In our setup, ×8 balances elasticity and scheduling overhead, delivering the best throughput–latency trade-off.
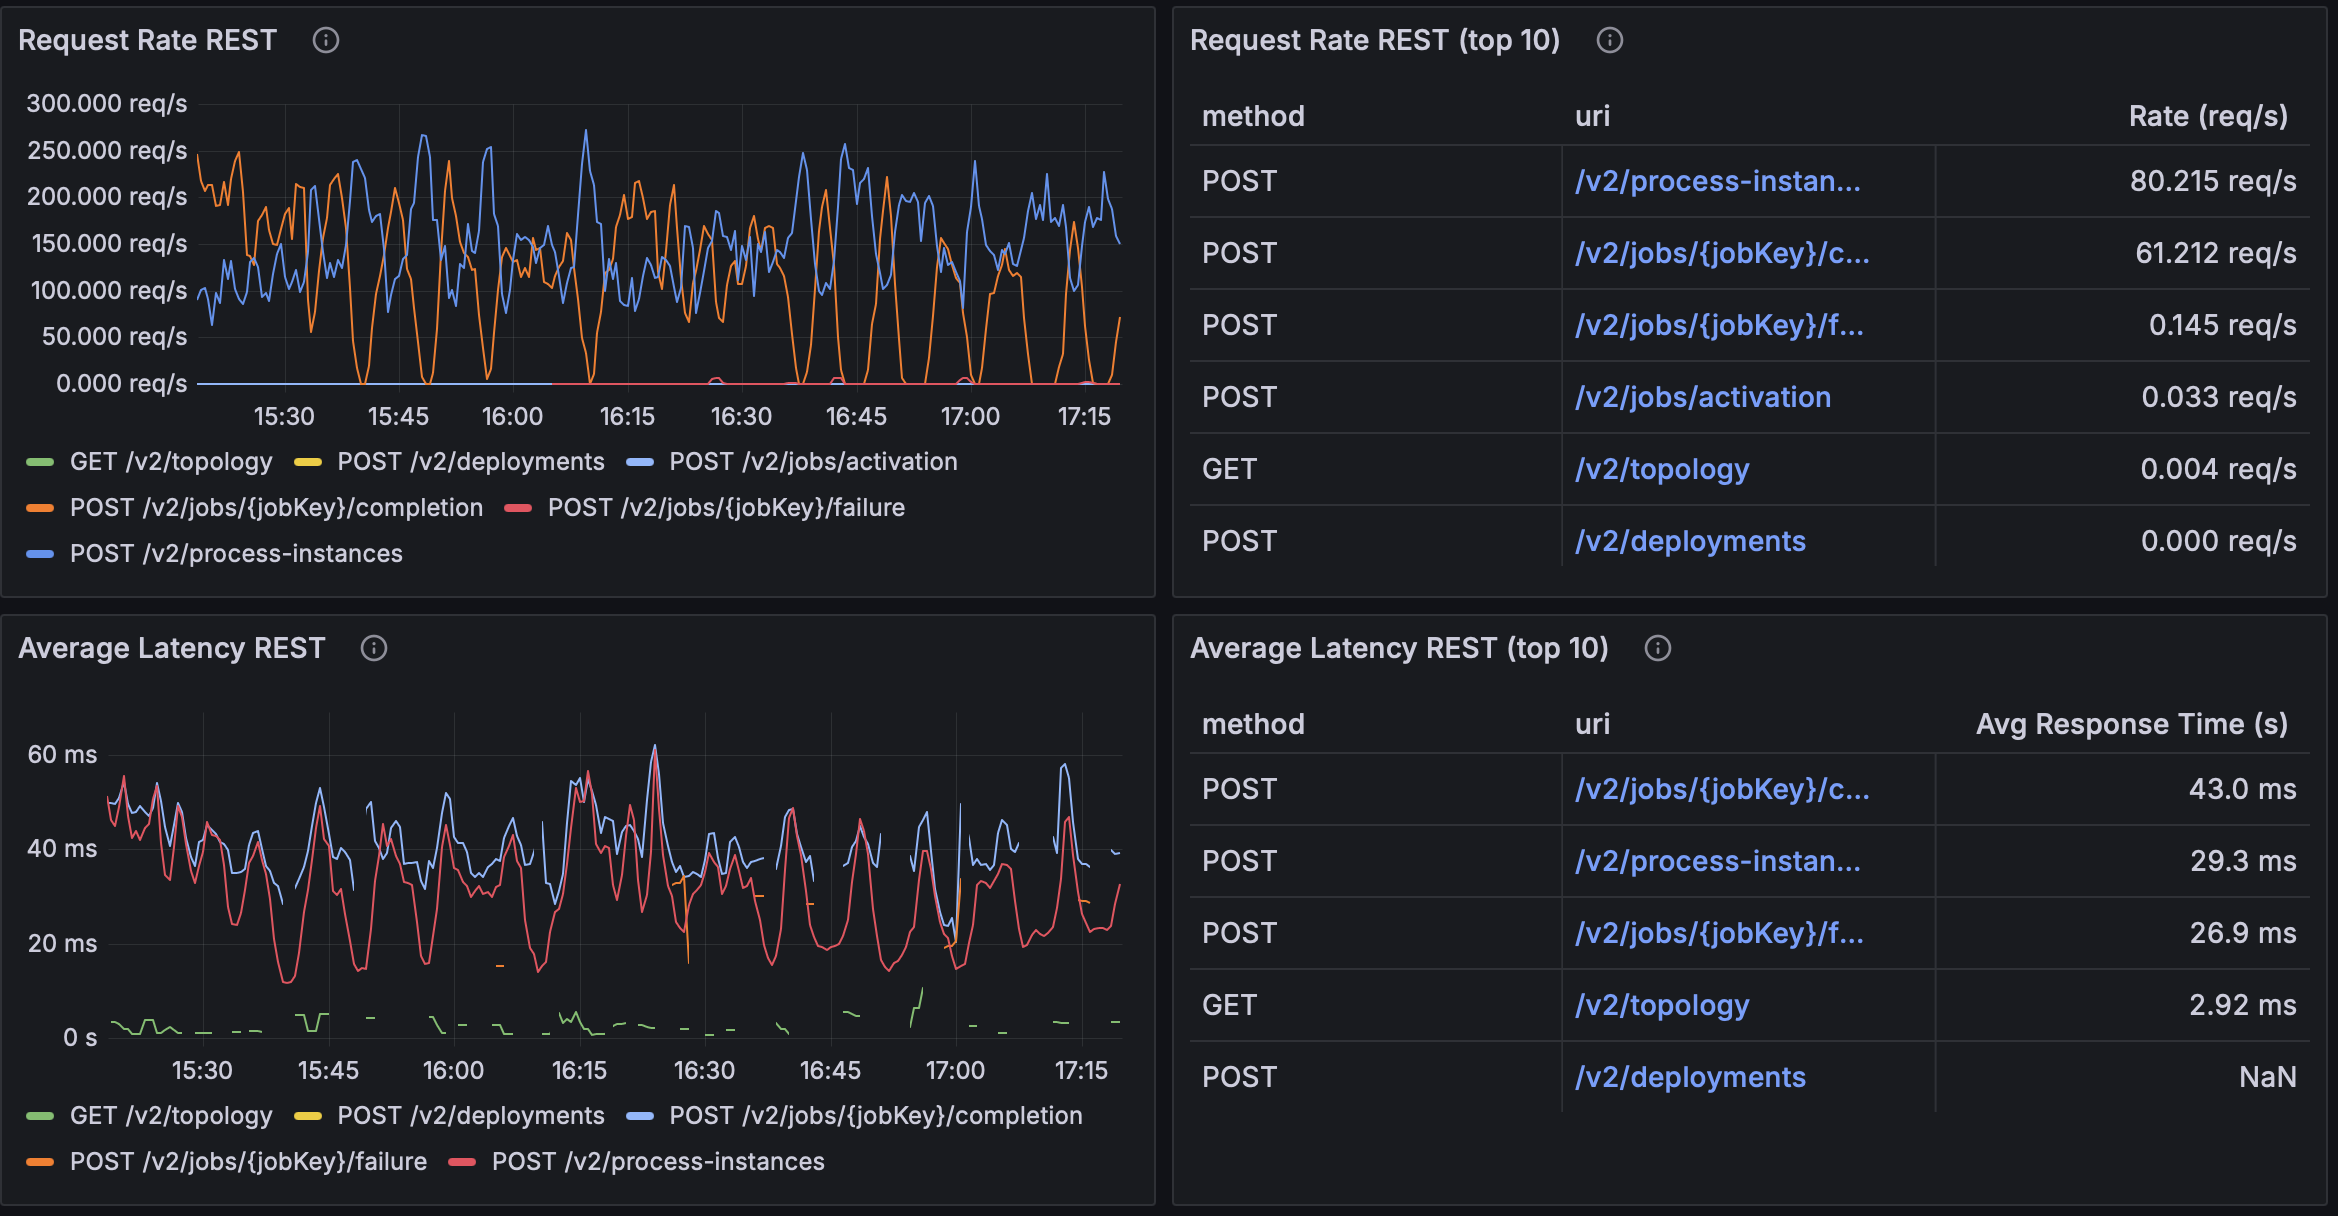
3) Comparing Queue Capacity (16 vs 64 vs 256)
We varied the executor queue capacity and compared 16, 64 (our current/default for this run), and 256 under the same workload.
Below are the observed tops from the Grafana panels for the two hot endpoints:
- POST /v2/process-instances
- POST /v2/jobs/{jobKey}/completion
queueCapacity=16
queueCapacity=64
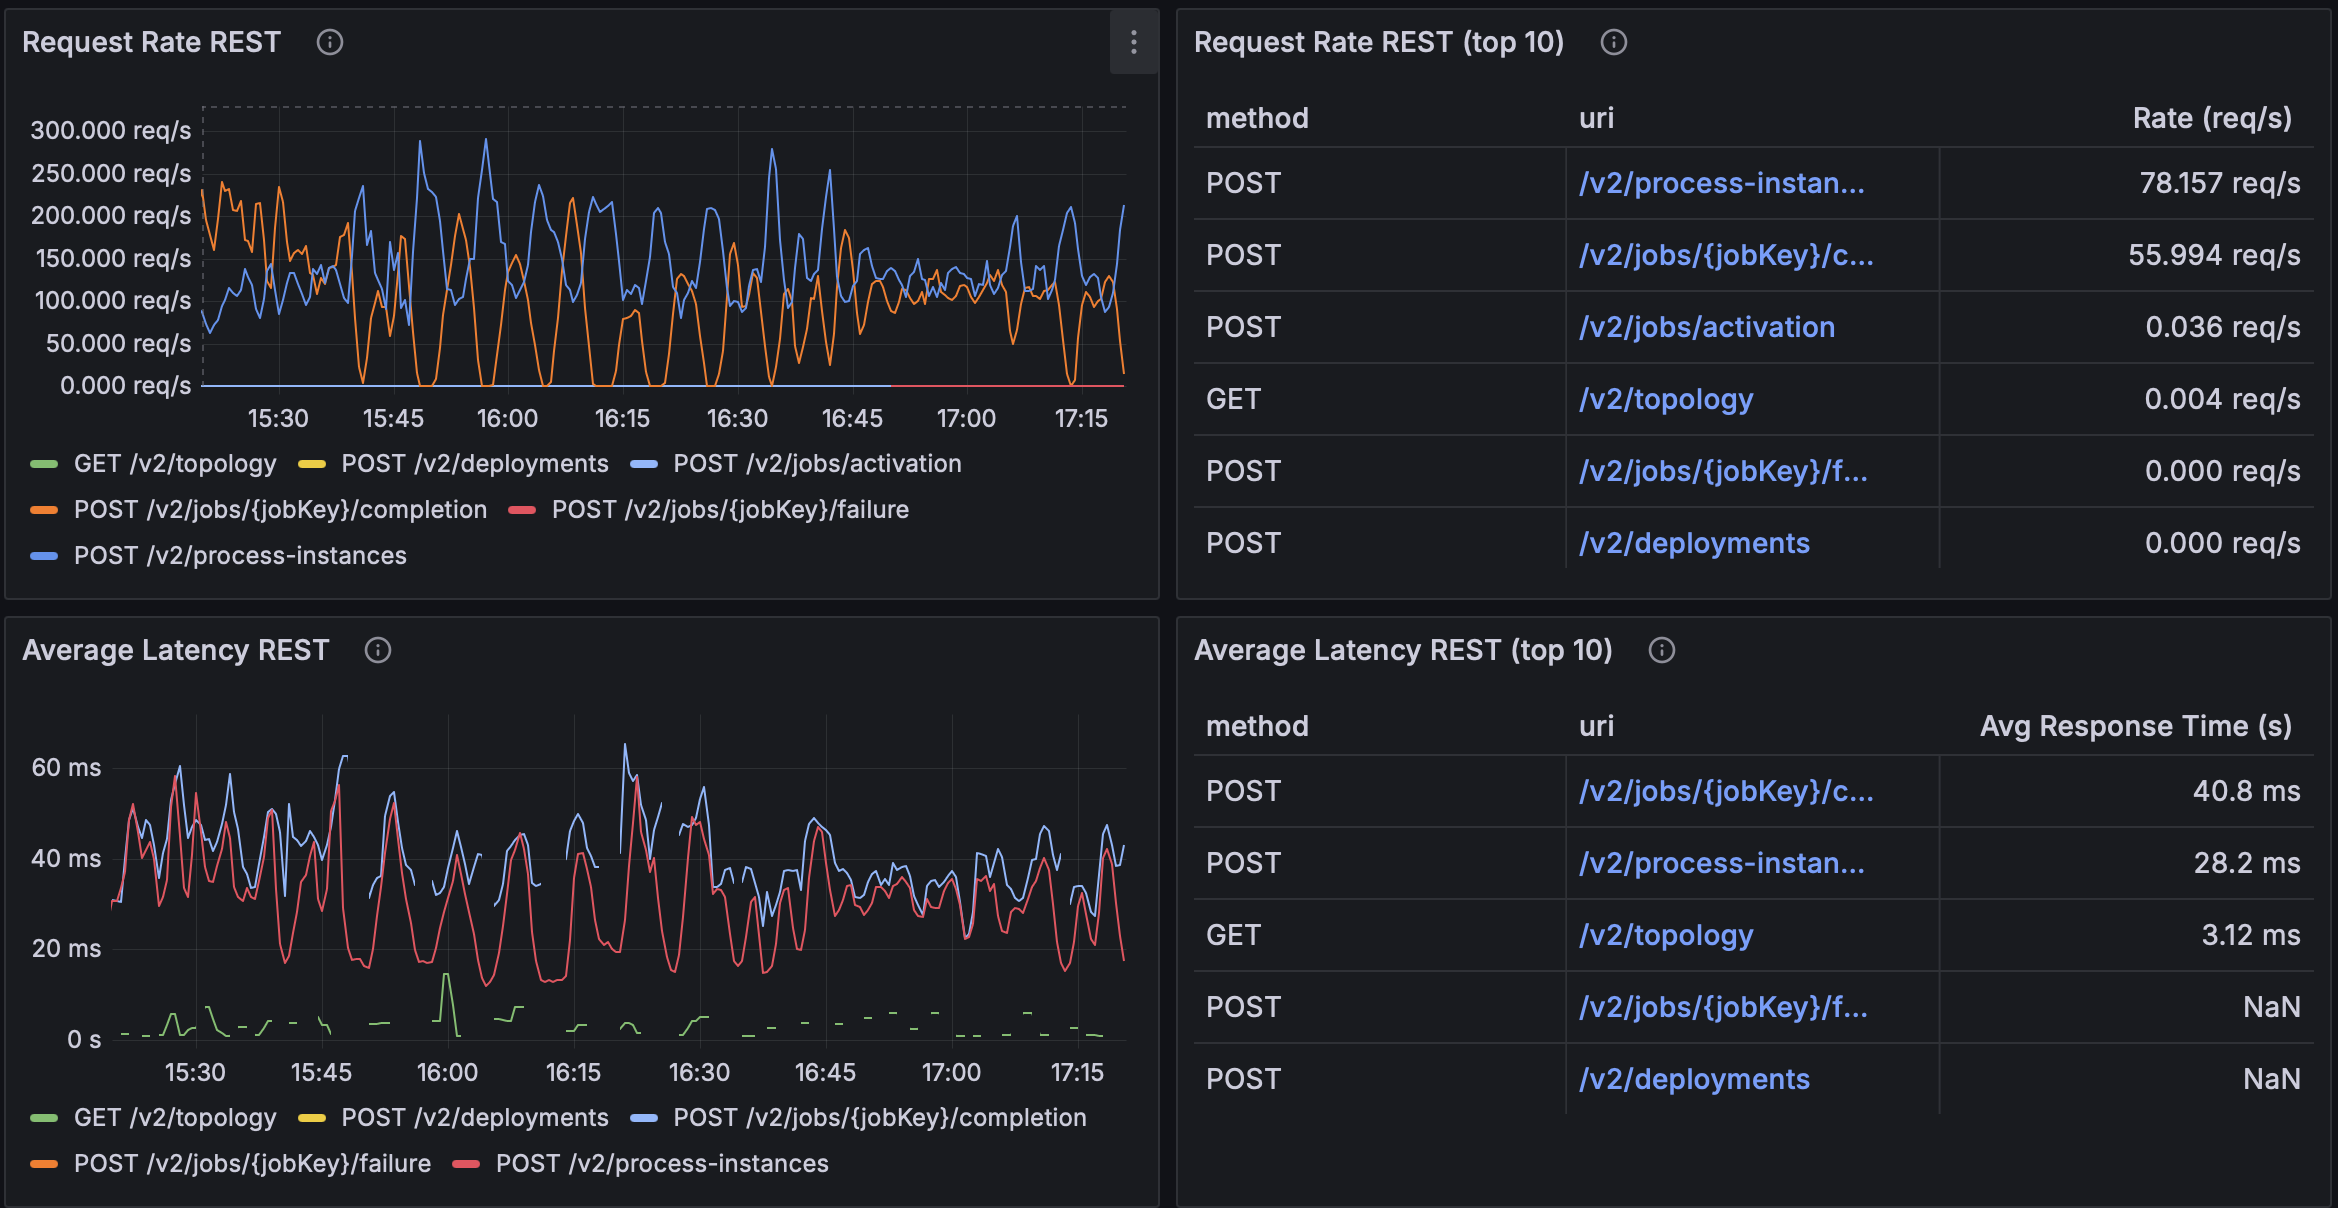
queueCapacity=256
Measured summary
| Queue Capacity | Request Rate (proc-instances) | Request Rate (completion) | Avg Latency (proc-instances) | Avg Latency (completion) |
|---|---|---|---|---|
| 16 | ~78.2 req/s | ~56.0 req/s | ~28.2 ms | ~40.8 ms |
| 64 | ~144.4 req/s | ~144.7 req/s | ~21.4 ms | ~24.1 ms |
| 256 | ~80.2 req/s | ~61.2 req/s | ~29.3 ms | ~43.0 ms |
What this suggests (in our setup):
- Queue = 64 is the clear sweet spot: highest sustained throughput (~144 req/s on hot endpoints) with the lowest avg latencies (~21–24 ms). Likely large enough to absorb micro-bursts, but small enough to avoid long queue waits.
- Queue = 16 under-buffers: lower RPS (~78 / ~56 req/s) and higher latency (~28–41 ms). With
CallerRunsPolicy, the queue fills quickly and the caller runs tasks often → frequent backpressure throttles producers. - Queue = 256 shows diminishing/negative returns relative to 64: lower RPS (~80 / ~61 req/s) and higher latency (~29–43 ms). The big buffer hides saturation, adding queueing delay before execution without delivering extra useful work at the same CPU budget.
Conclusion
Moving off the common ForkJoinPool to a dedicated, CPU-aware executor with bounded queueing and CallerRunsPolicy backpressure turned an overload problem into graceful degradation: fewer 5xxs, steadier RPS, and far lower tail latency under the same CPU budget.
Final takeaways
- Isolation beats sharing. A dedicated pool prevents noisy neighbors from the common
ForkJoinPool. - Backpressure beats drops.
CallerRunsPolicyslows producers when saturated, stabilizing the system without mass rejections. - Right-sized knobs matter.
maxPoolSize ≈ cores × 8andqueueCapacity ≈ 64hit the best throughput/latency balance in our runs; smaller queues over-throttle, larger queues hide saturation and add wait time. - Results are environment-specific. At higher core counts, the sweet spot may shift—re-benchmark when CPUs or workload mix change.
Note: Results are environment-specific; at higher core counts, the sweet spot may shift—re-benchmark when CPUs or workload mix change. In this experiment, we focused on CPU-bound scenarios.