REST API and OIDC


Over the past weeks, we have been spending more time improving our load testing and reliability testing coverage. One of the things we did was to enable REST API (by default, we tend to use gRPC).
While doing such, we were experiencing a weird load pattern. This seems to occur when enabling the REST API usage in our load tester clients, together with OIDC.
On today's Chaos day, we want to verify how the system behaves when using the REST API and OIDC together, and how this changes under different loads and versions. We were also validating whether this was related to the cluster configuration (testing with SaaS).
TL;DR; We were seeing recurring throughput drops, especially at higher load (300 PIs), but at lower load they were not visible. The issue was reproducible in 8.8 as well, so it was not related to the changes in 8.9. We couldn't reproduce the pattern in SaaS, as we weren't able to achieve the same load with the small clusters we used. While experimenting, we discovered several areas for improvement. The root cause turned out to be JWT tokens expiring while requests queued in the Apache HttpAsyncClient connection pool. Nic fixed this by moving token injection to after connection acquisition via #50124 🚀
Chaos Experiment
As mentioned earlier, we were testing the system with REST API enabled and OIDC. We were testing different loads (100, 200, 300 PIs) and different versions (8.8 and main). We also wanted to validate whether this is related to the cluster configuration, so we also tested with SaaS.
The following experiments were run:
- Stress test with 300 PIs
- Lower load 100 PIs
- Lower load 200 PIs
- Test with SaaS 300 PIs
- Test with 8.8 300 PIs
Expected
As we already experienced this pattern, we expected to see it again when enabling REST API and OIDC together. We expected that this was related to the load, so for a lower load, this should not be visible. We also expected that this might be related to the version, so we shouldn't see the same pattern in 8.8. Finally, we were not sure whether this was related to the cluster configuration, so we wanted to validate whether we could see the same pattern in SaaS or not.
Expectations:
- Stress test with 300 PIs - we expect to see the pattern
- Lower load 100 PIs - we expect not to see the pattern
- Lower load 200 PIs - we expect to see the pattern, but less visible
- Test with SaaS 300 PIs - we were not sure - if it is not visible it might be related to a different cluster configuration
- Test with 8.8 300 PIs - we expect not to see the pattern, as it should be related to the changes in 8.9
Actual
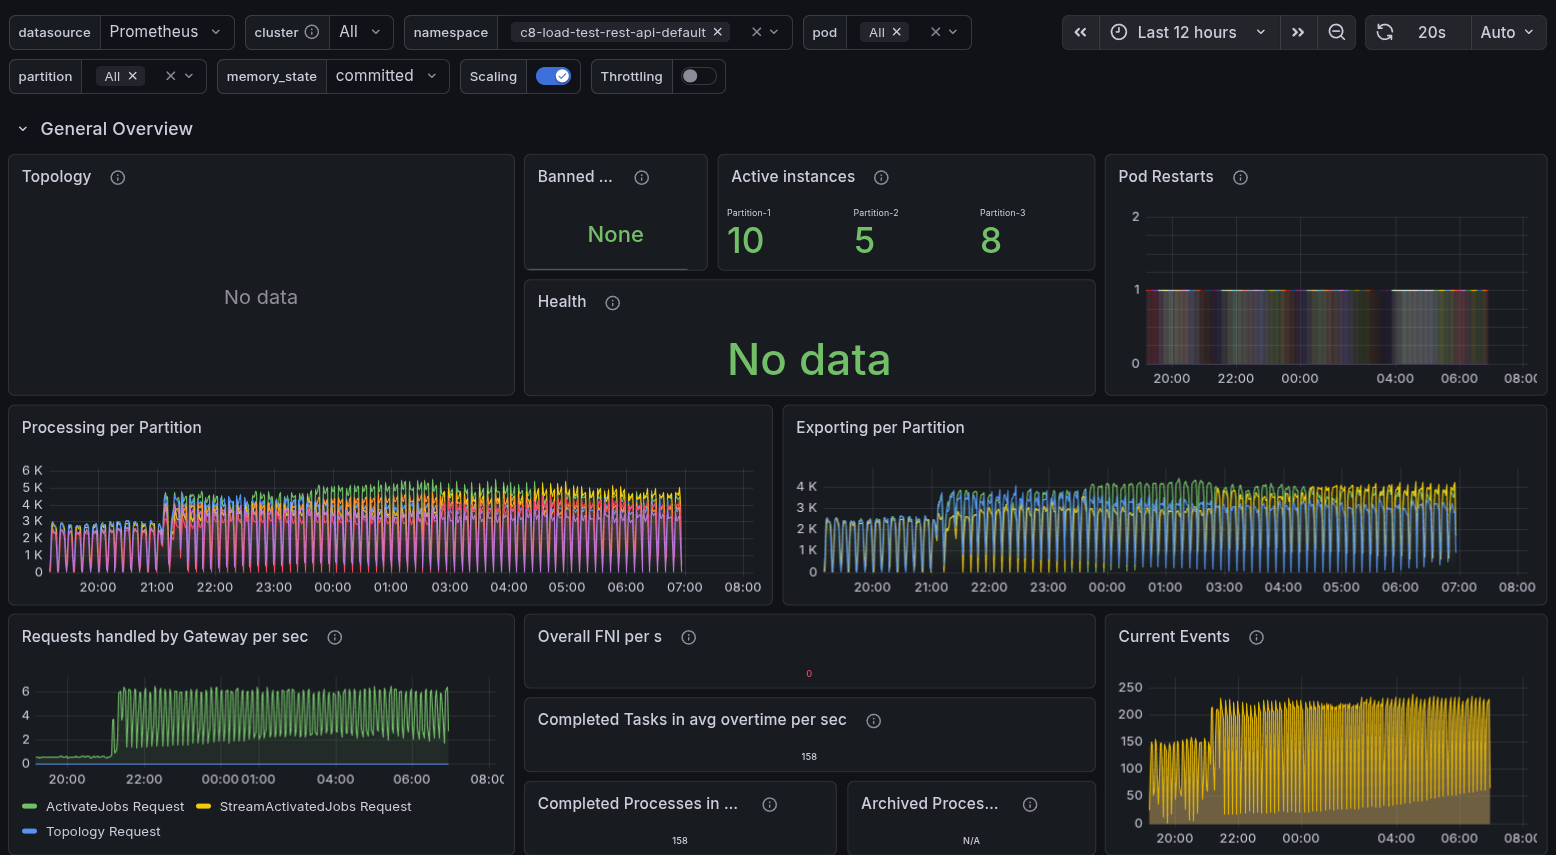
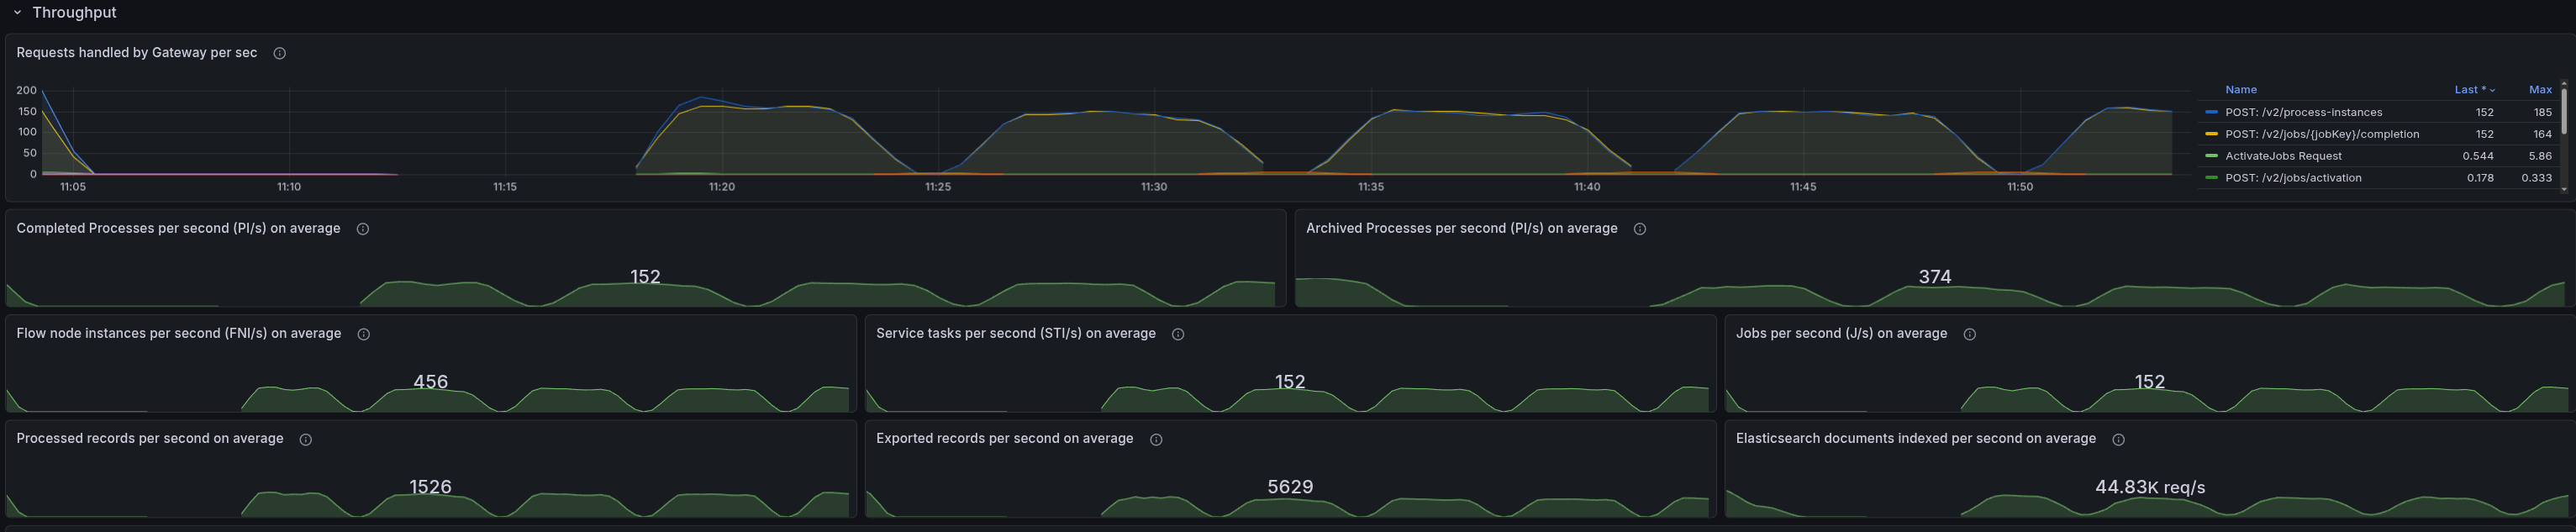
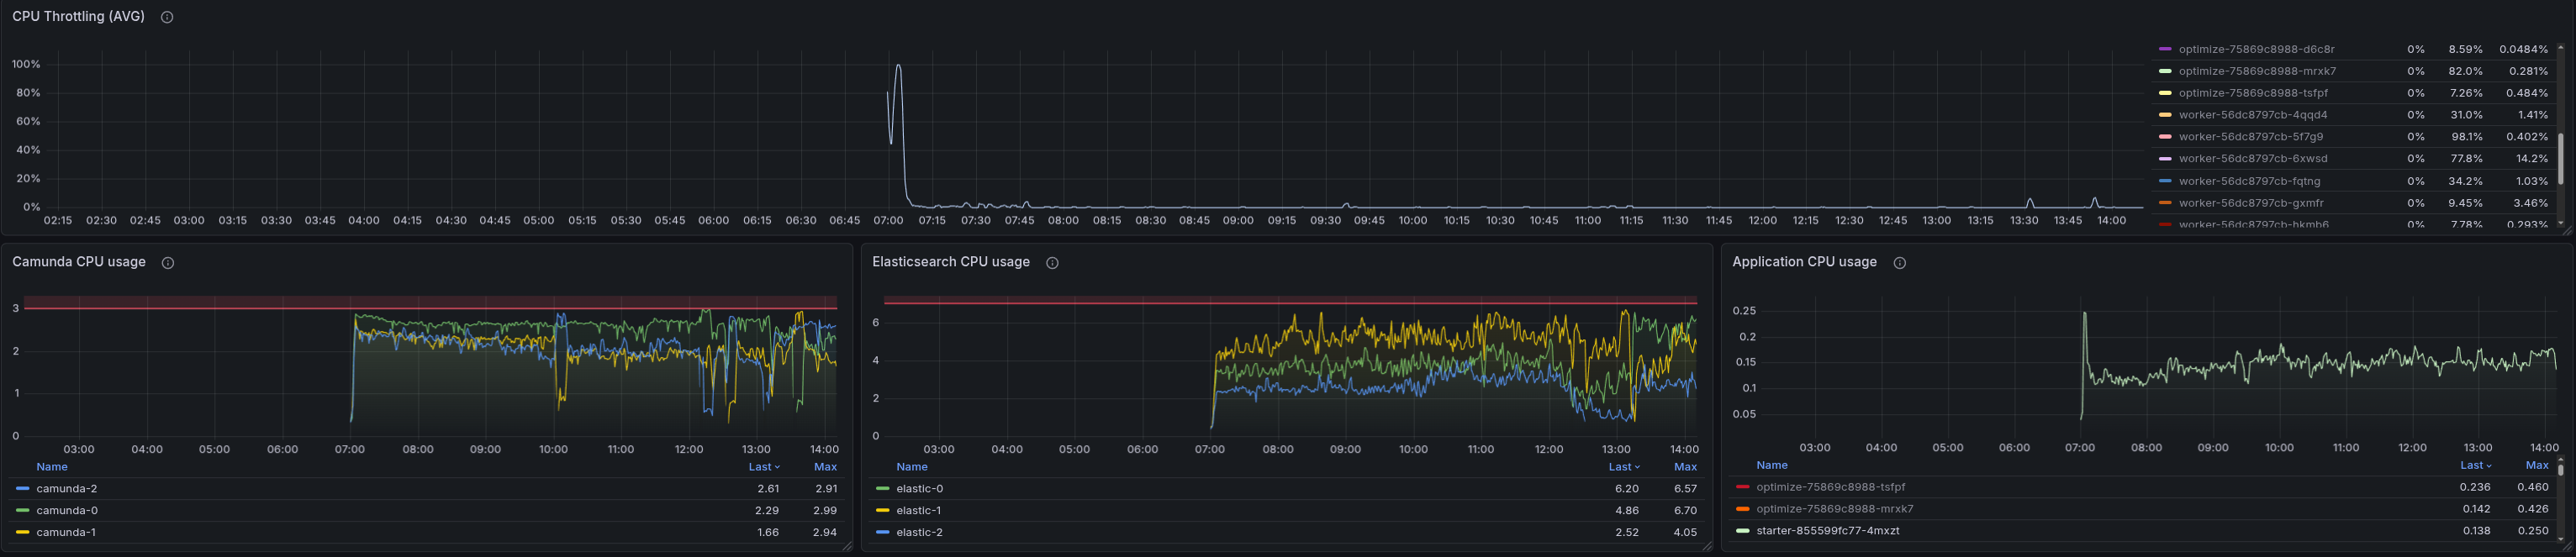
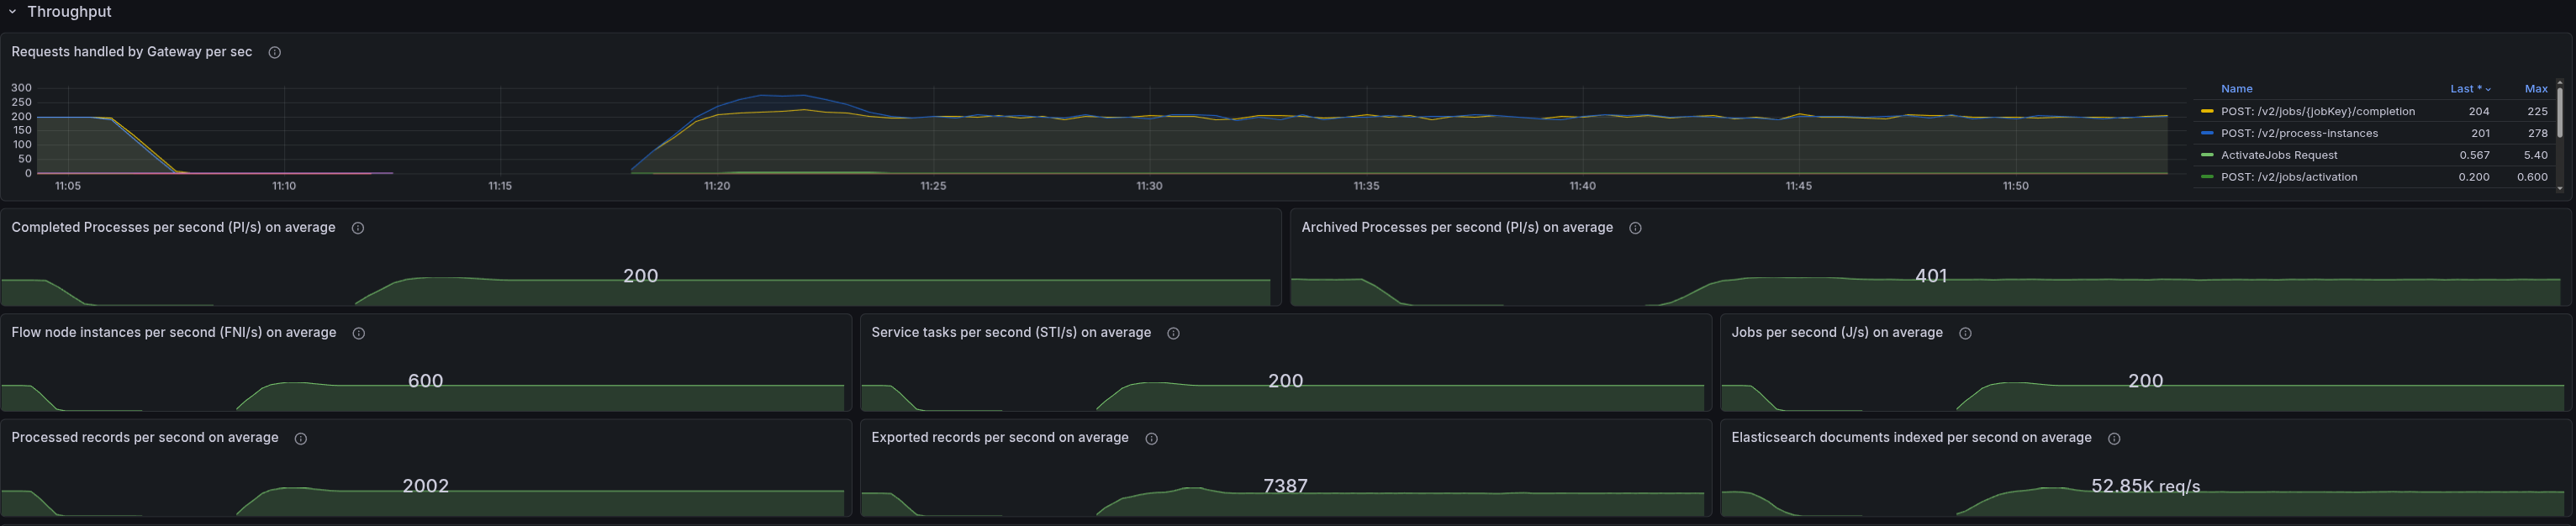
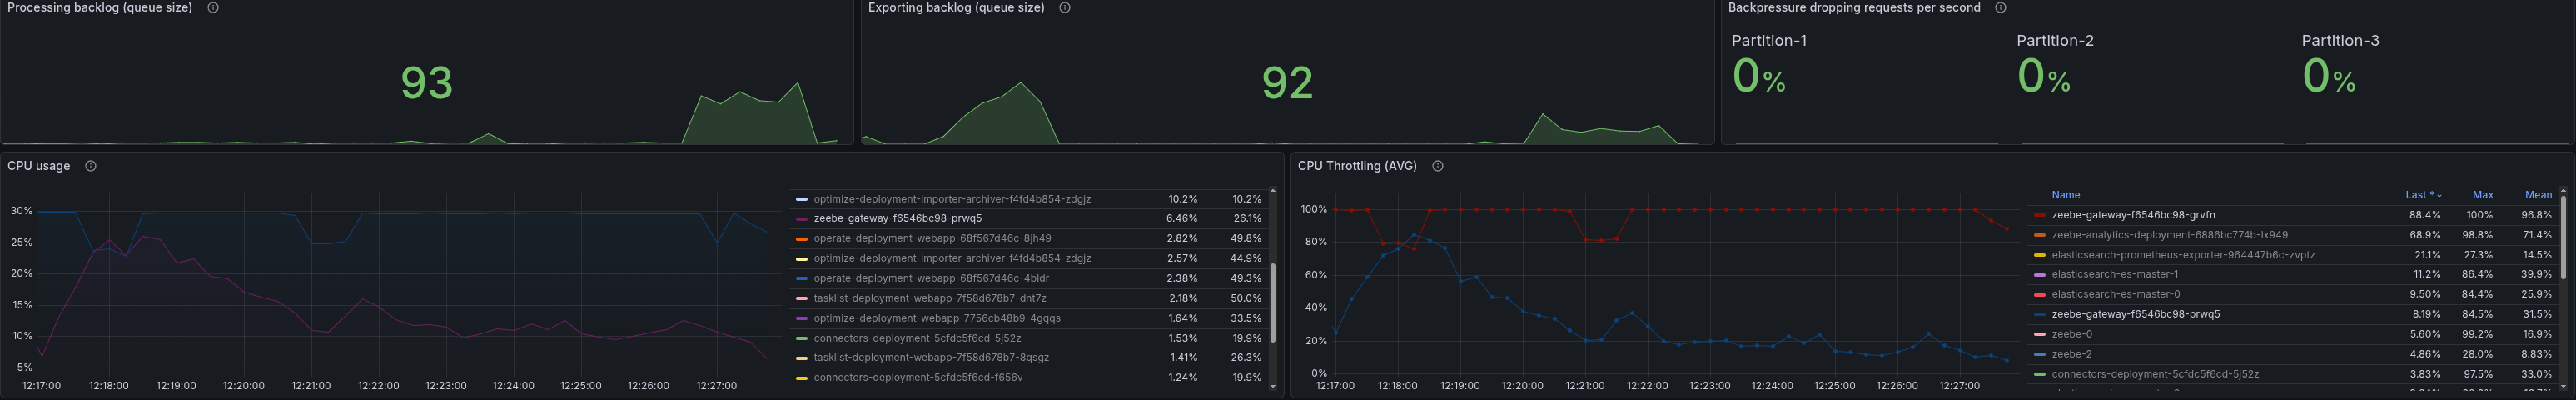
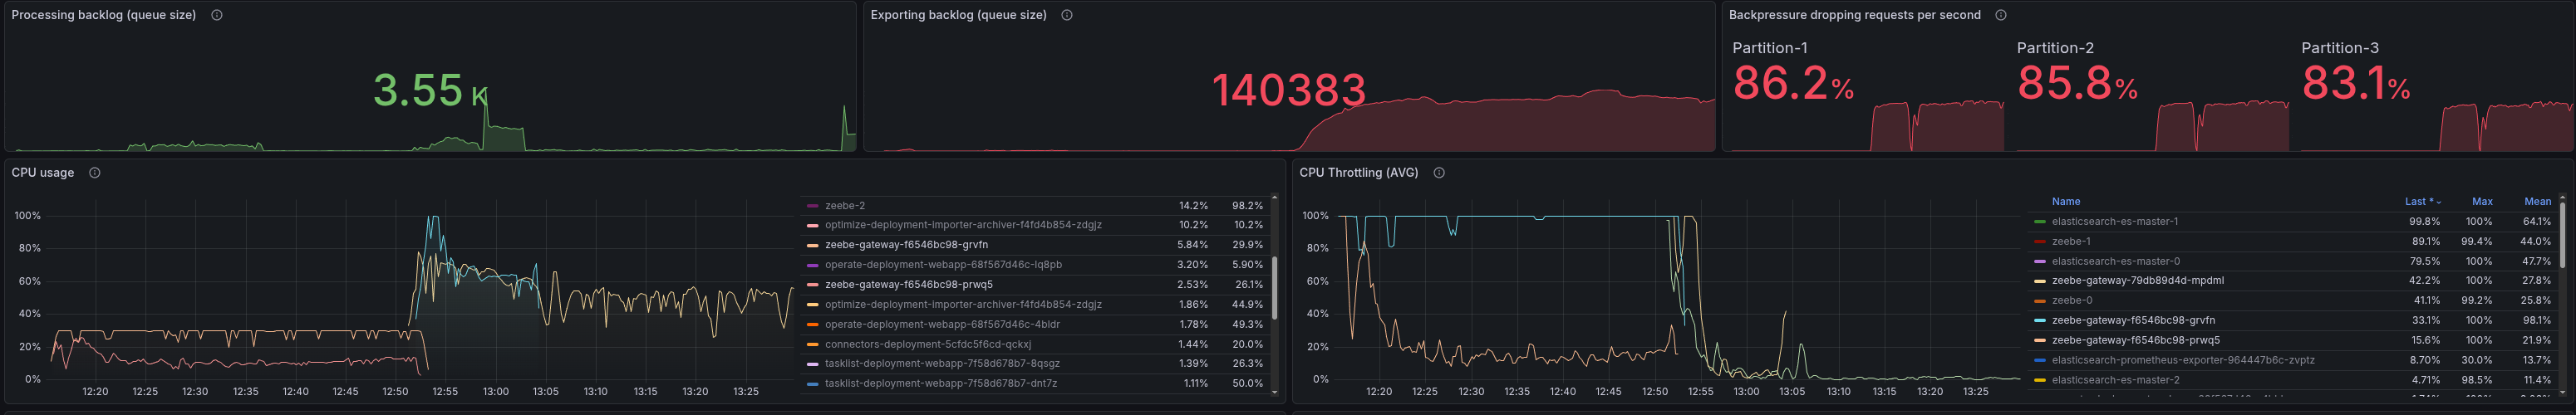
Stress test with 300 PIs
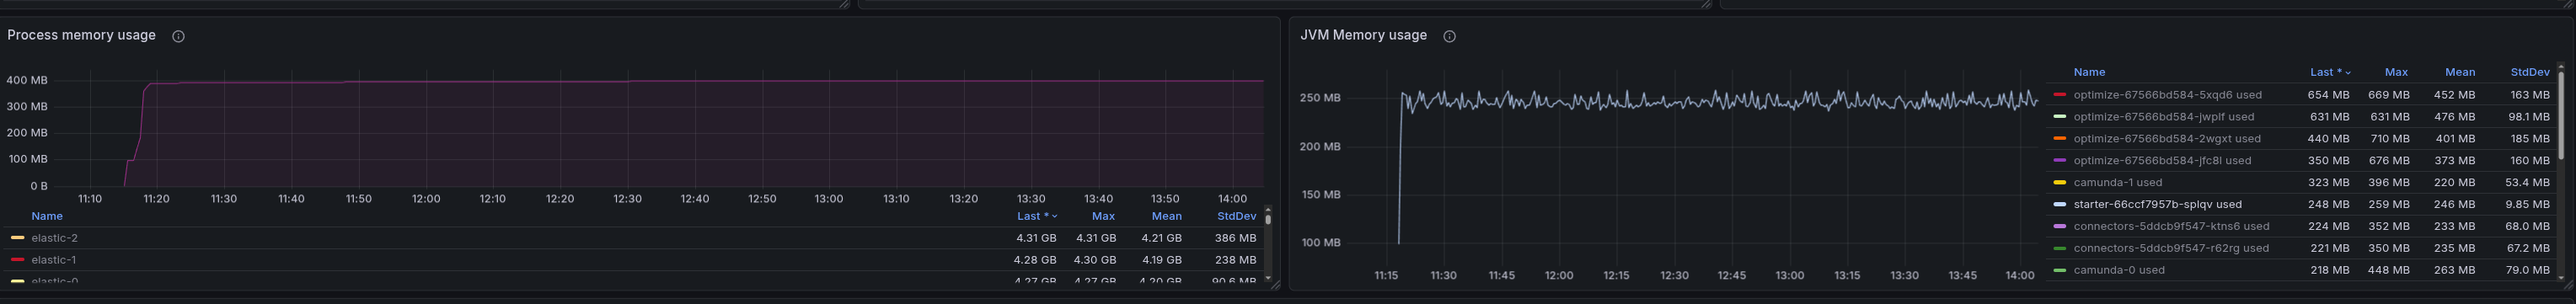
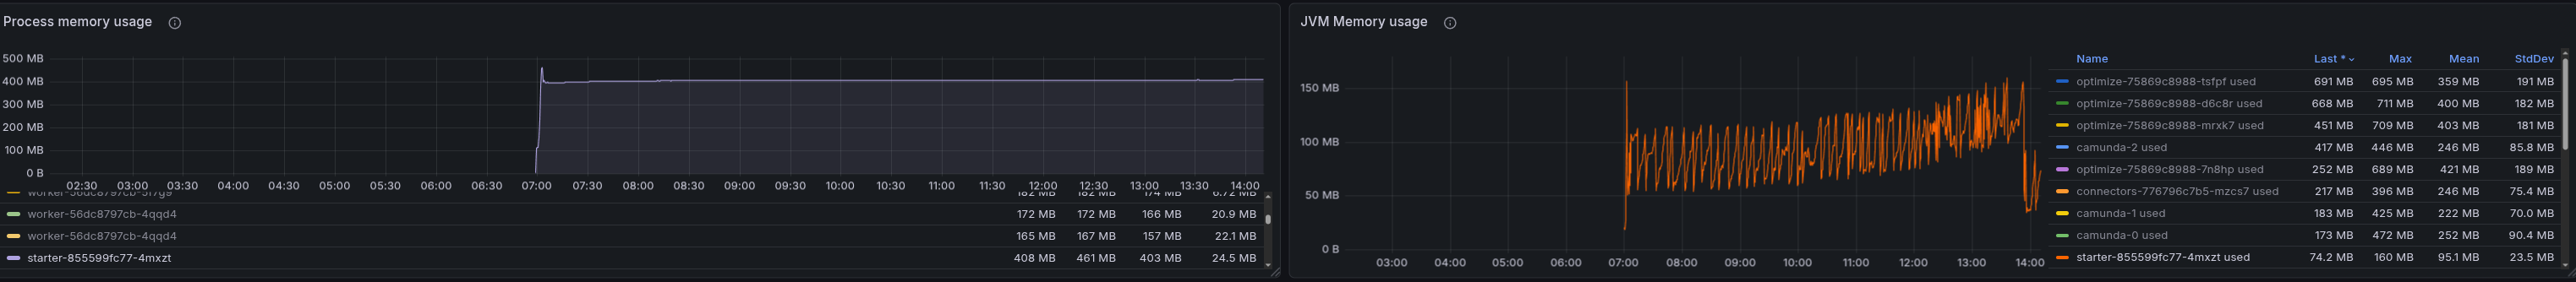
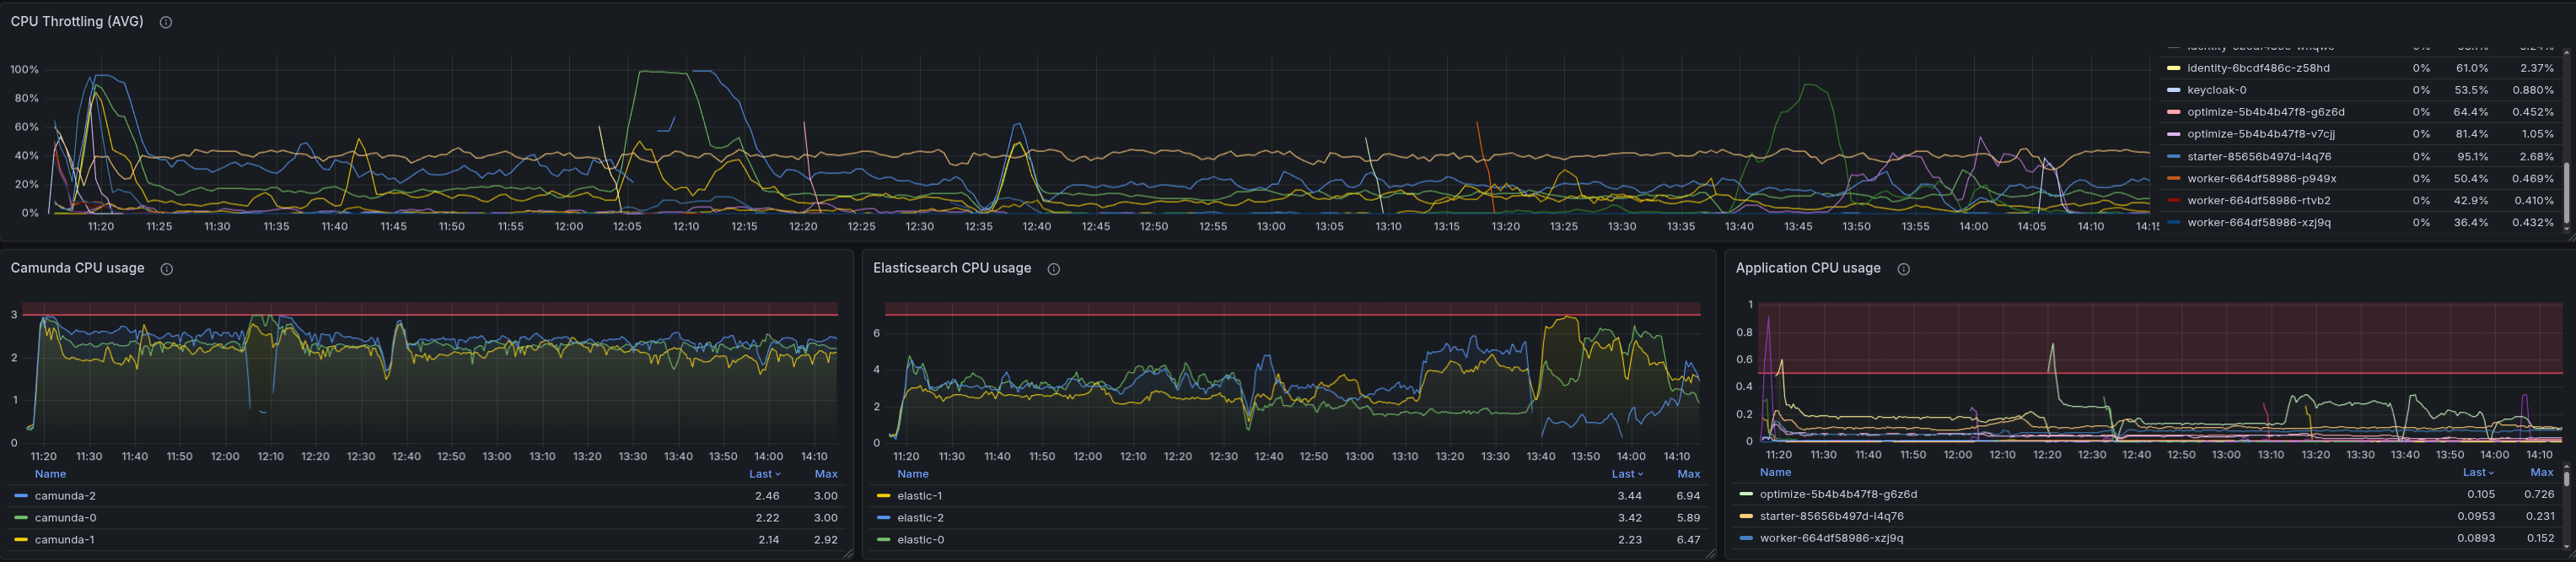
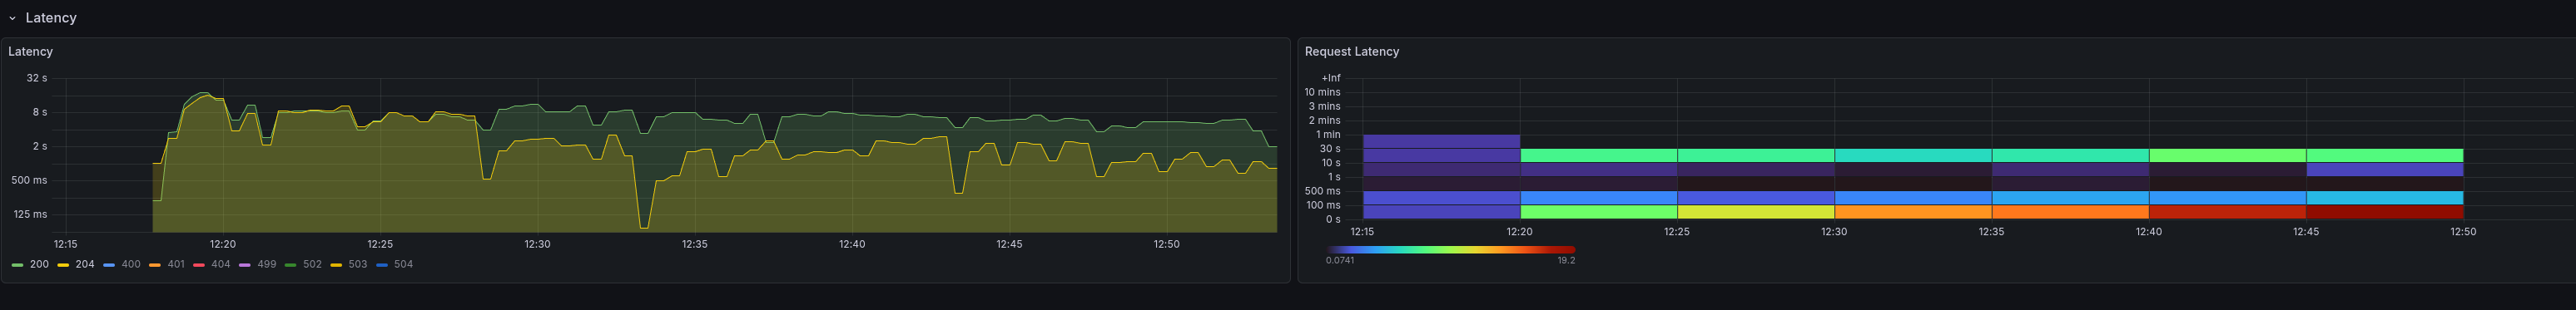
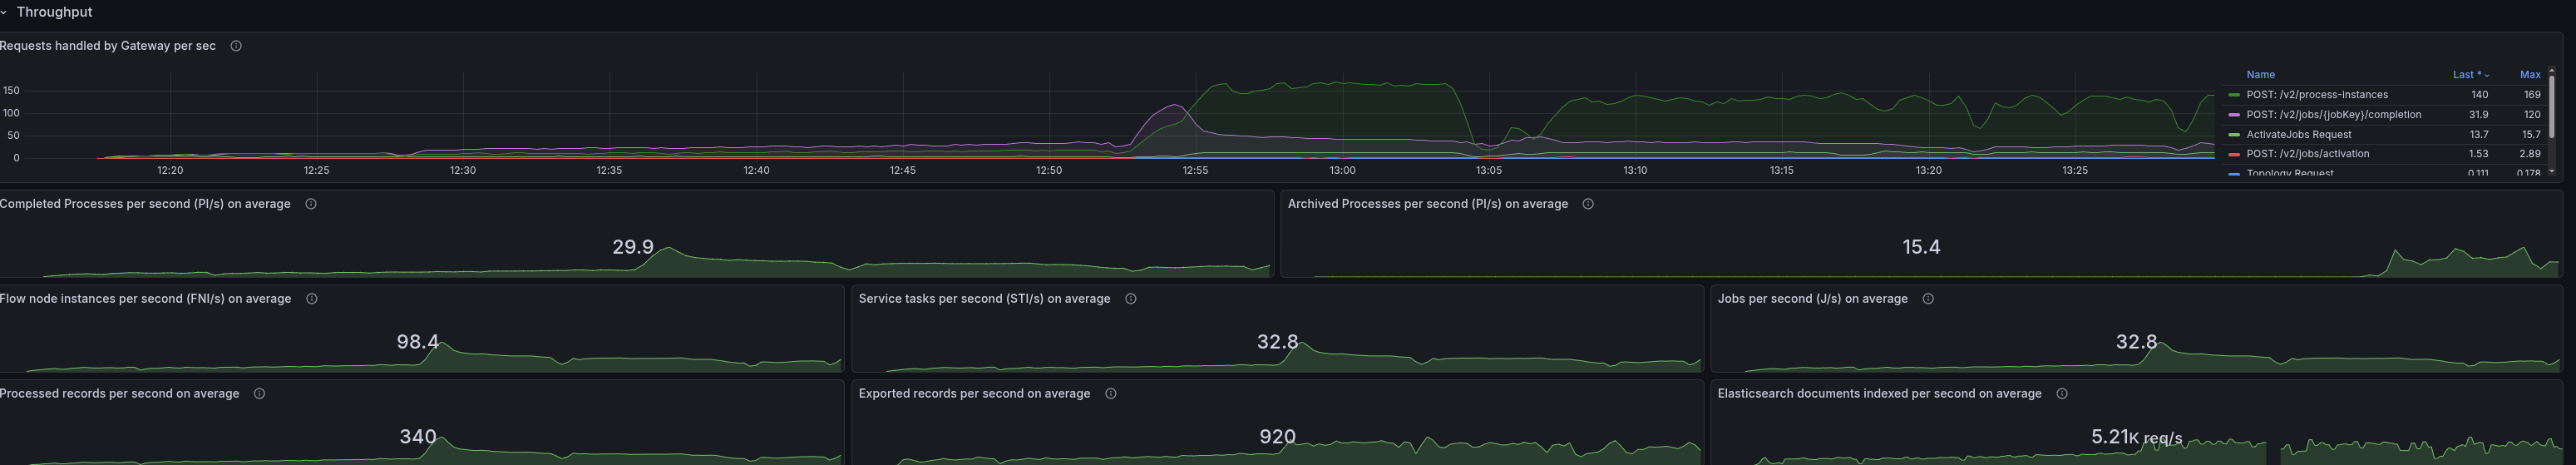
When we set up a stress test with 300 PIs and the REST API enabled, we observed the pattern we had already seen. The starter is heavily CPU throttled and under high memory pressure. We were not able to reach 300 PIs; we reached ~140.
In general, it is interesting that we tend to use much more memory and CPU when using the REST API, whereas with gRPC, we are not seeing such high resource usage. This is something we need to investigate further, as it is unexpected and should not occur.
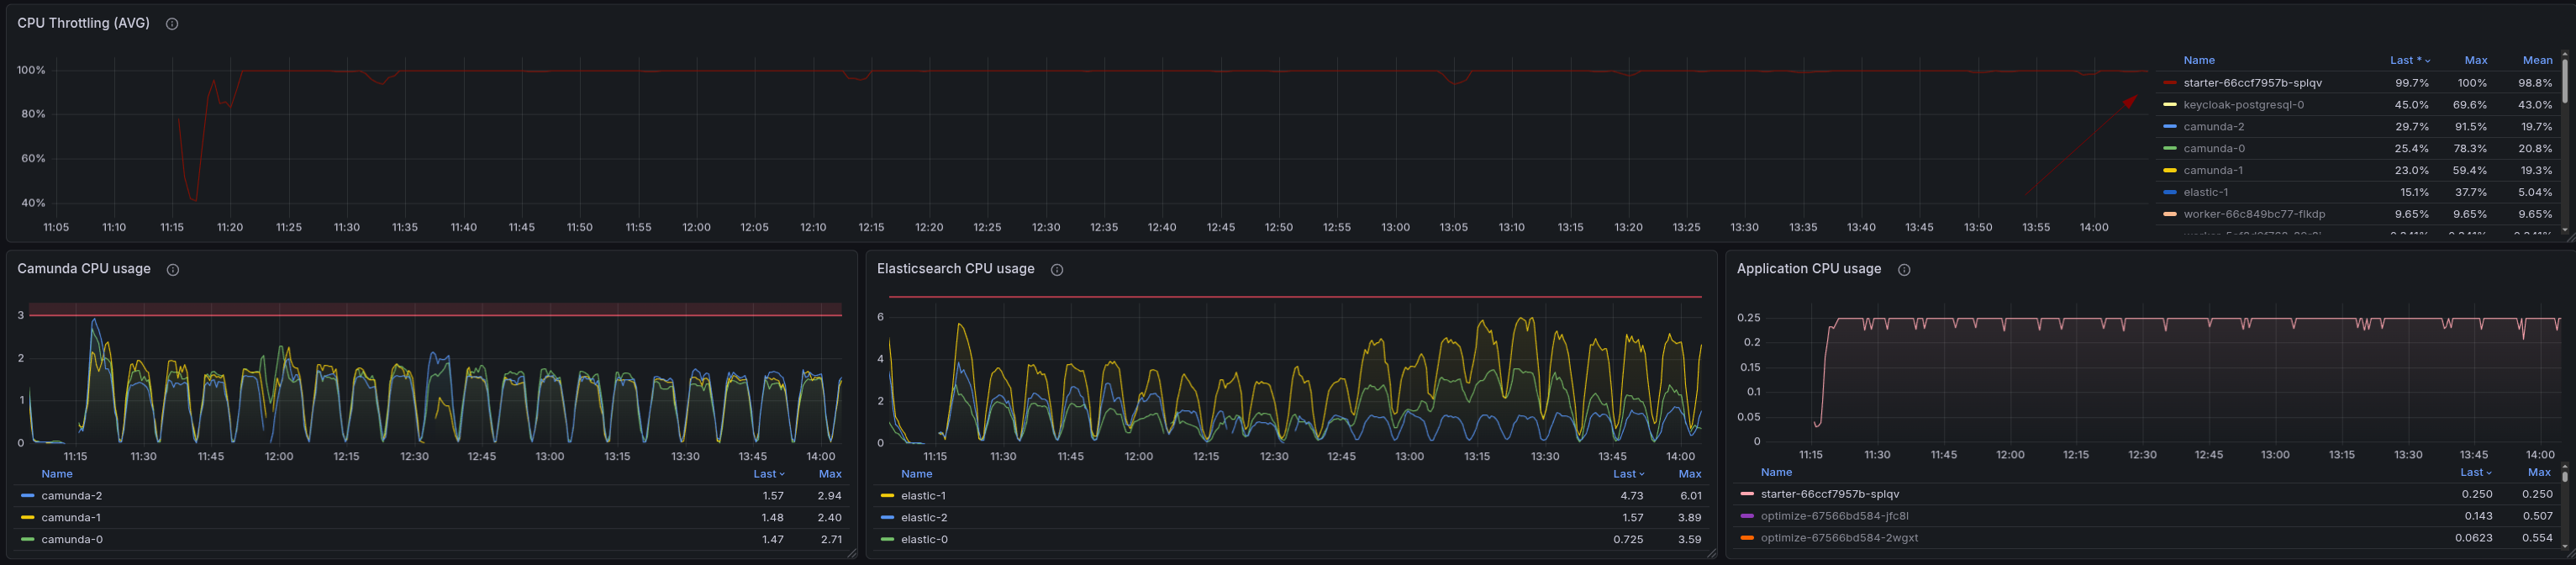
When we compare this to our daily stress tests, which are run with gRPC, we can see that the starter is not CPU-throttled and shows no signs of memory pressure.
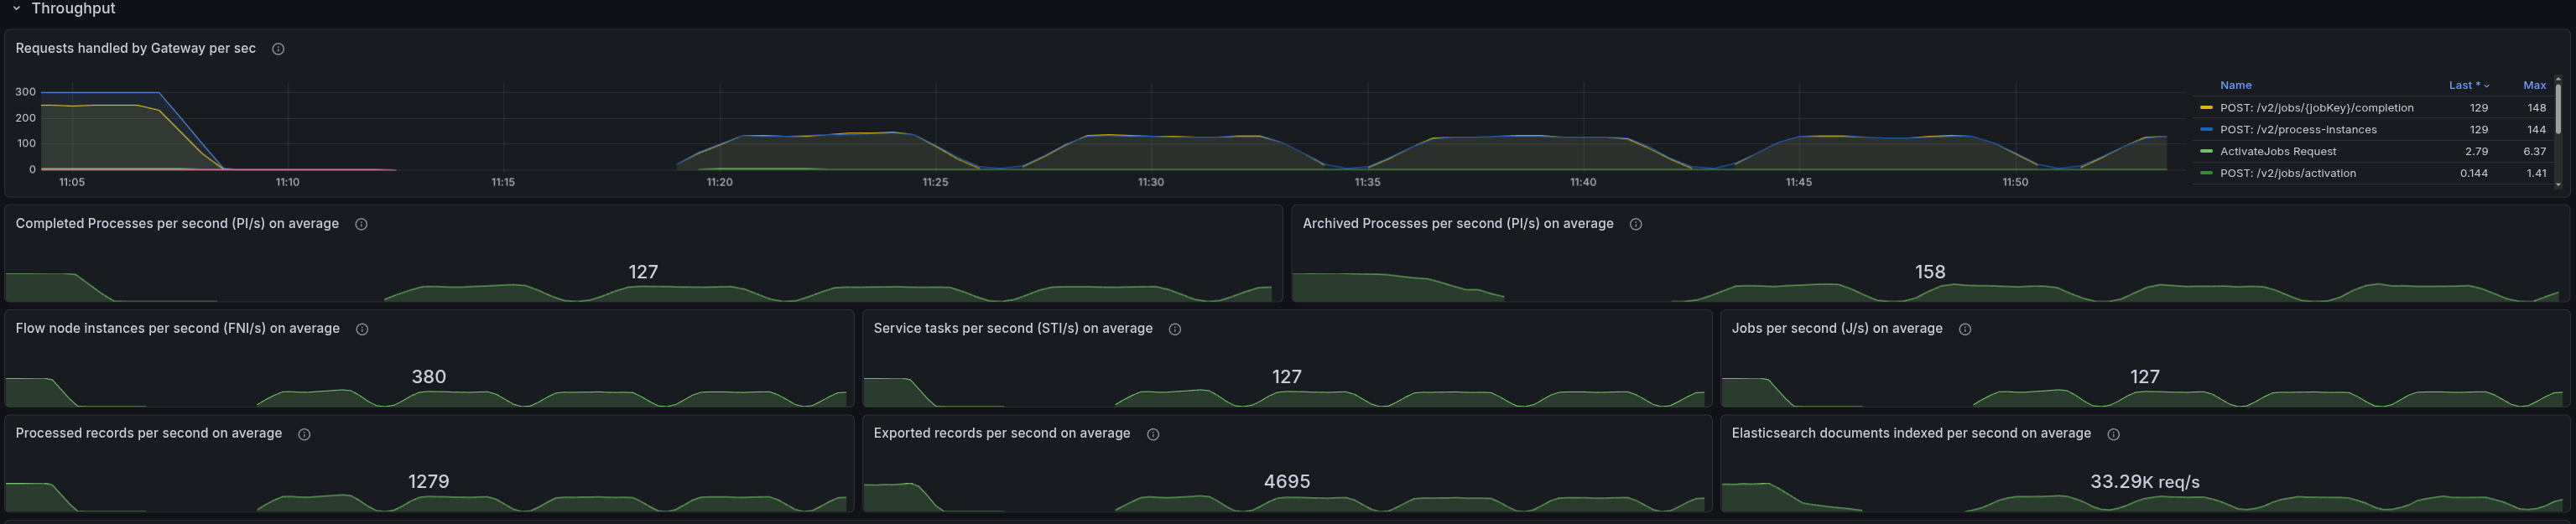
Lower load 100 PIs
When setting up a lower load with 100 PIs, we no longer saw the pattern. The starter is not CPU throttled, and there are no signs of memory pressure.
Lower load 200 PIs
Contrary to our expectation, with 200 PIs we were also not able to see the pattern. The starter is not CPU throttled, and there are no signs of memory pressure. This suggests the threshold for triggering the issue lies somewhere between 200 and 300 PIs.
Test with 8.8 300 PIs
When testing with 8.8, we were still able to see the pattern, so this indicates it is not related to the changes in 8.9 and either an existing bug or related to some configuration.
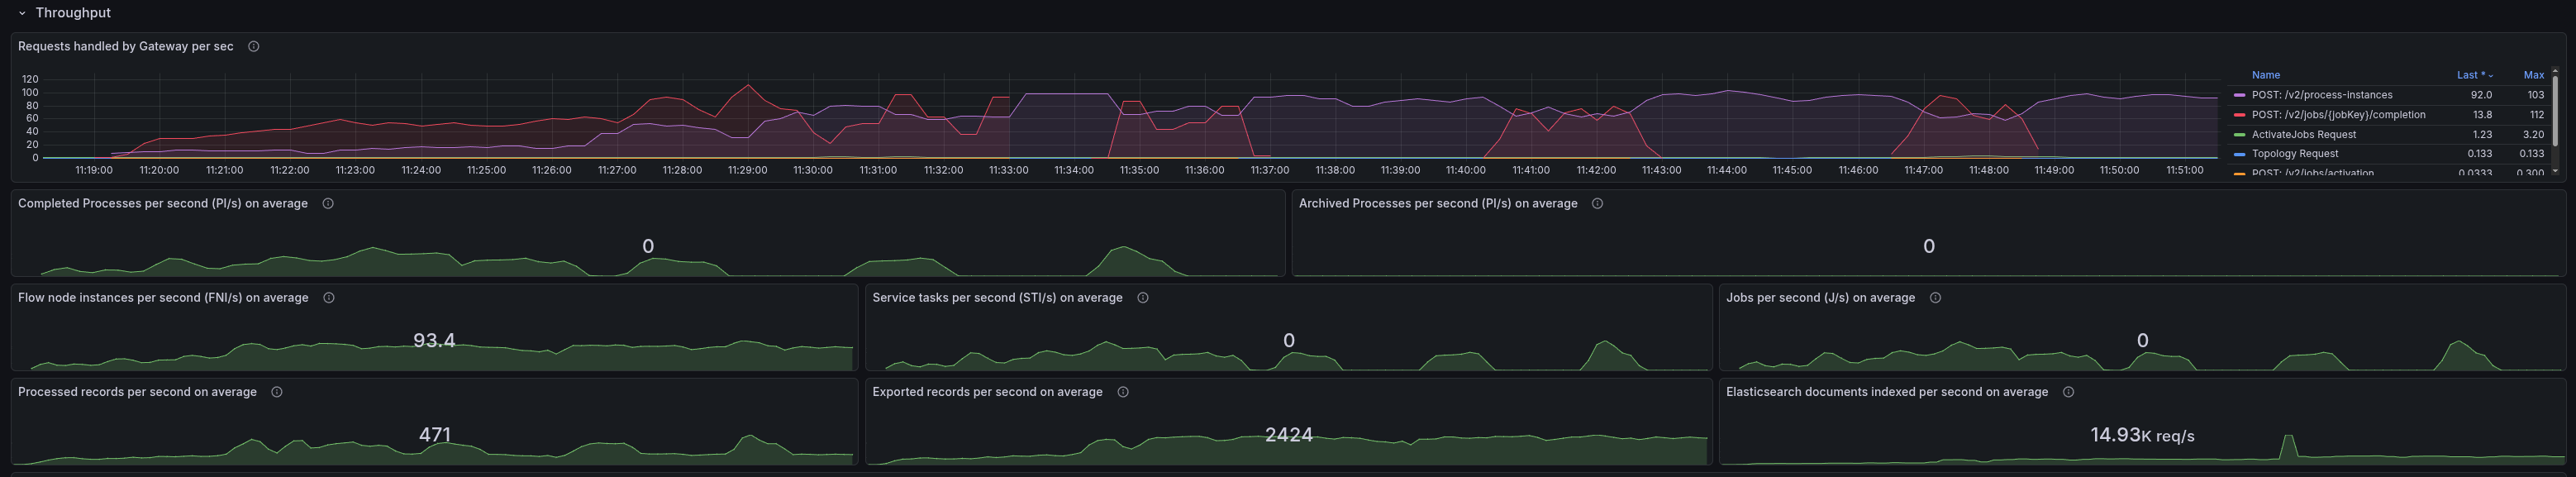
Test with SaaS 300 PIs
When testing with SaaS, we were not able to reach the same load as with our self-managed clusters (as we used quite small packages).
There were several surprising behaviors we observed during experimentation with the SaaS clusters:
- When starting an 8.9 cluster in SaaS, we were observing that the job completion rate dropped to 0 in a recurring pattern.
- When testing with an 8.8 cluster, we observed that even when starting 300 PIs (from our load applications), the cluster was actually only processing 10 PIs, but we haven't seen any back pressure (from the server or client side).
8.9 Cluster (SaaS)
When starting an 8.9 cluster in SaaS, we were observing that the job completion rate dropped to 0 in a recurring pattern.
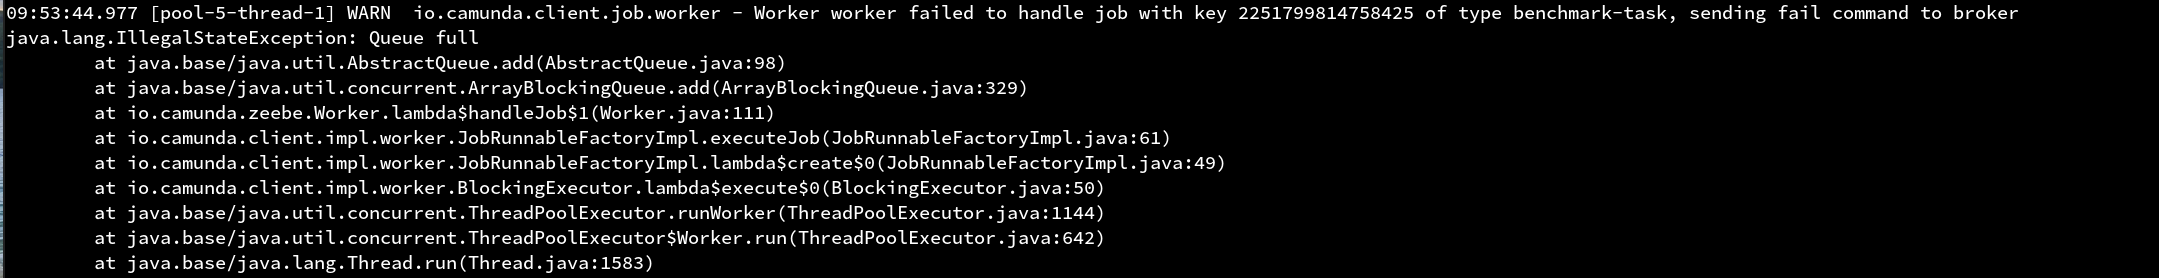
This was unexpected, and further investigation revealed that the workers were actually going OOM. After digging deeper through the metrics, we saw that too many jobs were pushed to the clients, and the worker was actively rejecting them.
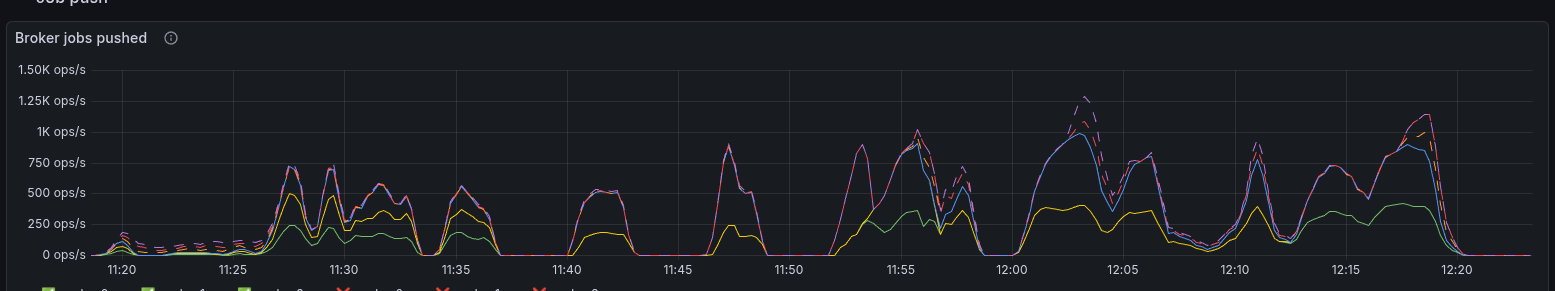
In comparison to our daily tests, we seem to send a factor ~2-3 more jobs to the clients.
After increasing the workers' memory, we reduced OOMs, but we still couldn't reach the same load as in our self-managed clusters, preventing us from reproducing the same behavior.
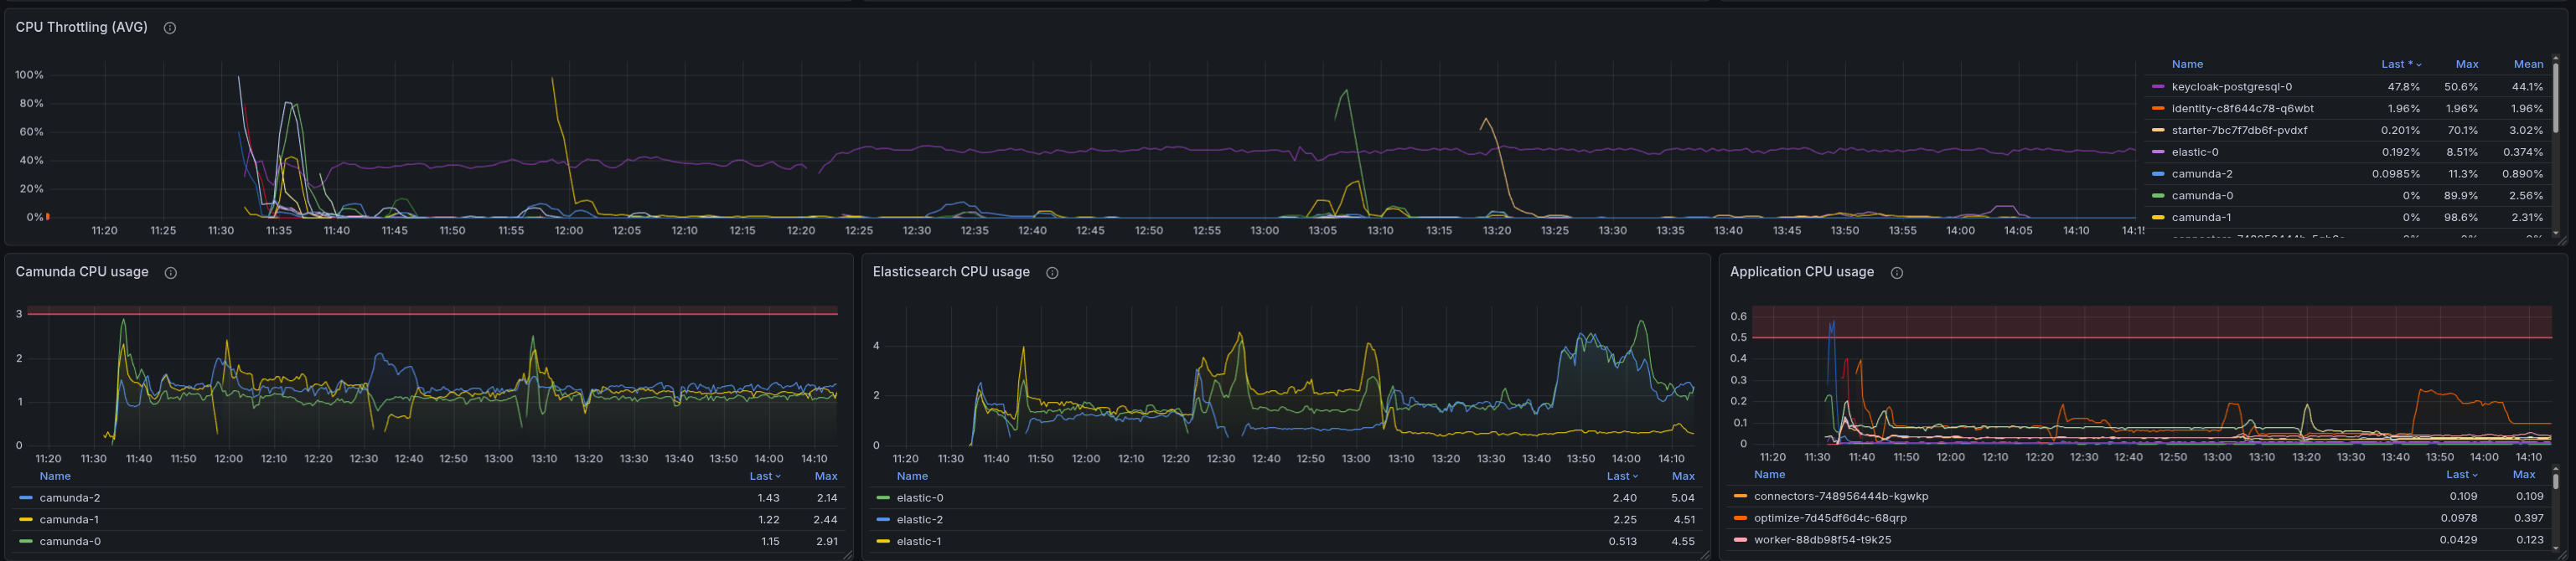
8.8 Cluster (SaaS)
As we expected certain misconfigurations, we wanted to validate the same with 8.8 in SaaS. When starting the 300-PI load, we were only able to reach ~10 PIs.
Even more interesting is that we were unable to see any back pressure on the server or client side, which is unexpected, given that we are pushing more load than the cluster can handle. But we observed that the gateway is actually heavily CPU-throttled. Interesting to note that almost all traffic hit one node.
Each request took 5-9s to complete, which might be why we are not seeing any back pressure, as the clients are not sending more requests until the previous ones are completed. The HTTP client we use might be saturated.
When we increased the gateway resources, we were able to reduce the CPU throttling and reached higher load. Now we were also able to see backpressure.
Overall, we were unable to reproduce the original REST+OIDC throughput drop pattern in SaaS due to resource constraints on the small cluster packages we used.
Root Cause REST API + OIDC Throughput Drop
During our experiments, Nic identified and fixed the underlying issue in #50124. The root cause was in the Java client's HTTP (REST) path: the Authorization: Bearer <token> header was attached at request-build time, long before the request actually reached the server.
Under high load, the Apache HttpAsyncClient's connection pool was saturated. Requests sat in the internal queue for 60-120 seconds between token attachment and wire send. By the time the request reached the server, the JWT had expired, causing periodic spikes of 401 Unauthorized errors.
gRPC was not affected because it uses CallCredentials.applyRequestMetadata(), a late-binding API that resolves the token just before dispatching the request on the wire.
The fix replaced the early-binding applyCredentials() call with an HttpRequestInterceptor registered via addRequestInterceptorLast(). This interceptor runs after the connection is acquired from the pool, right before writing bytes to the socket — reducing the gap between token injection and wire send to effectively zero.
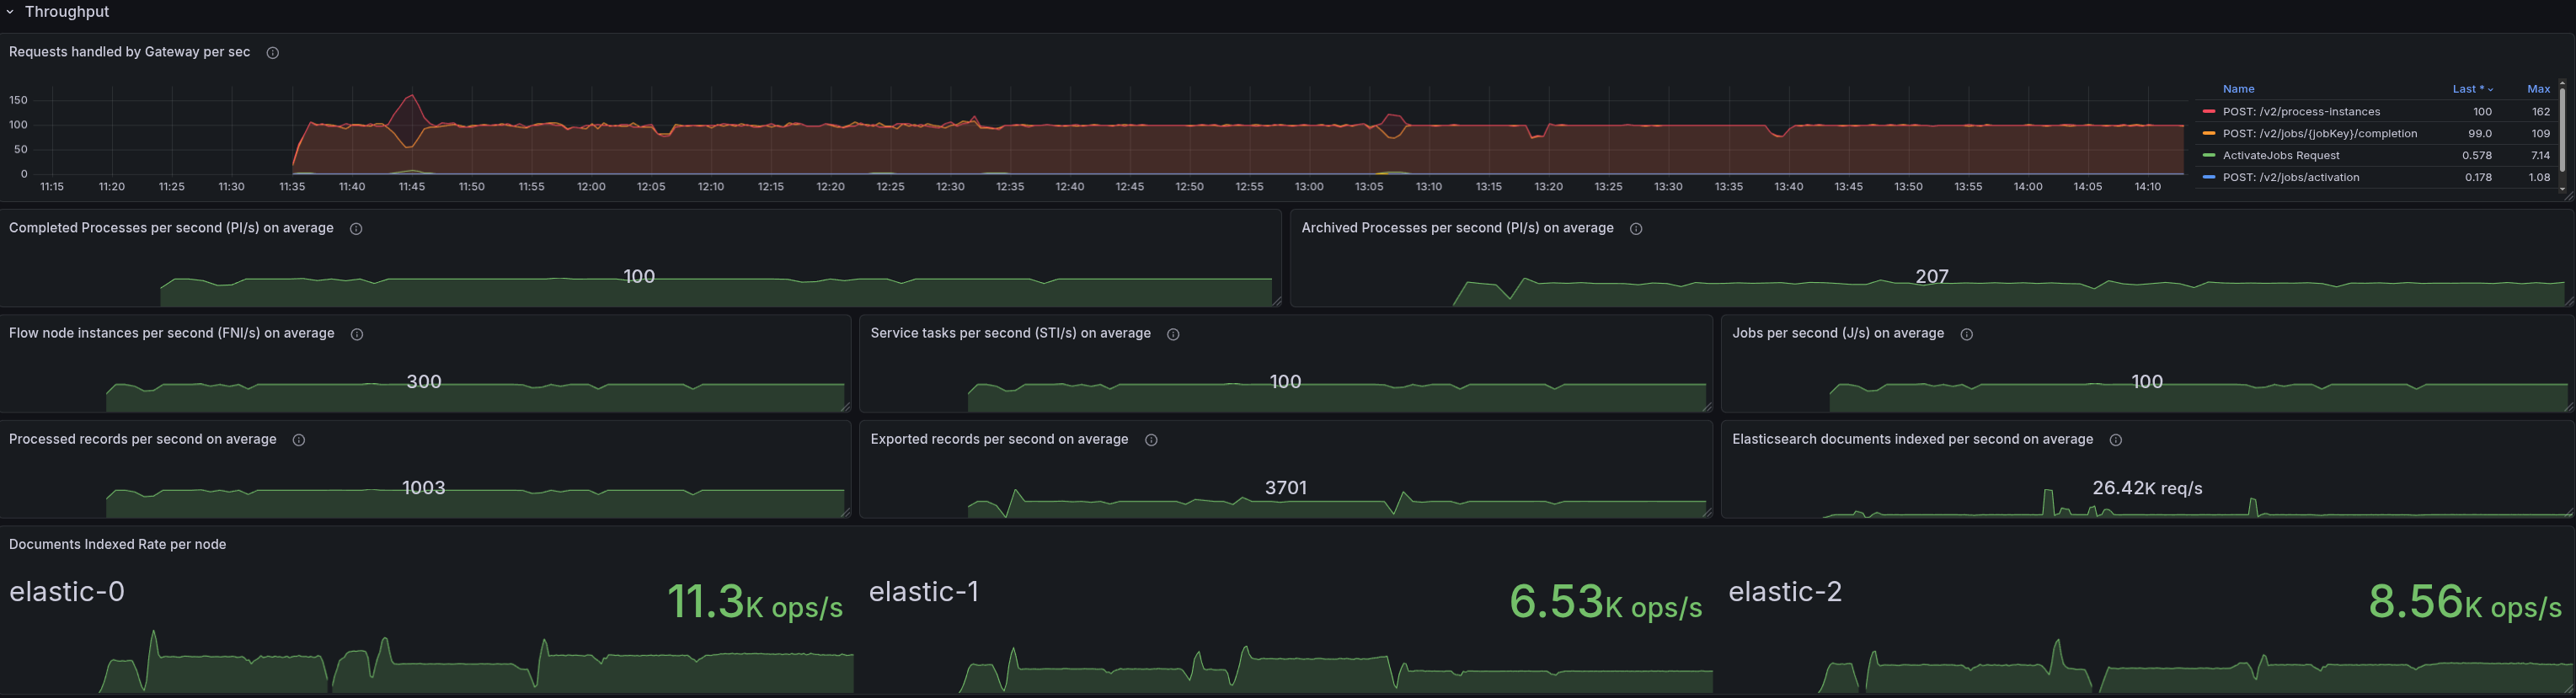
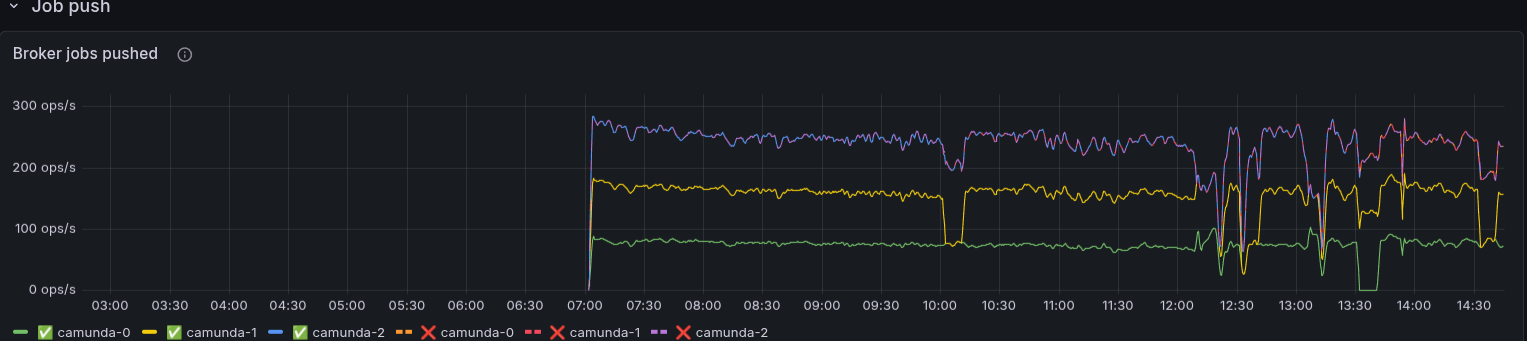
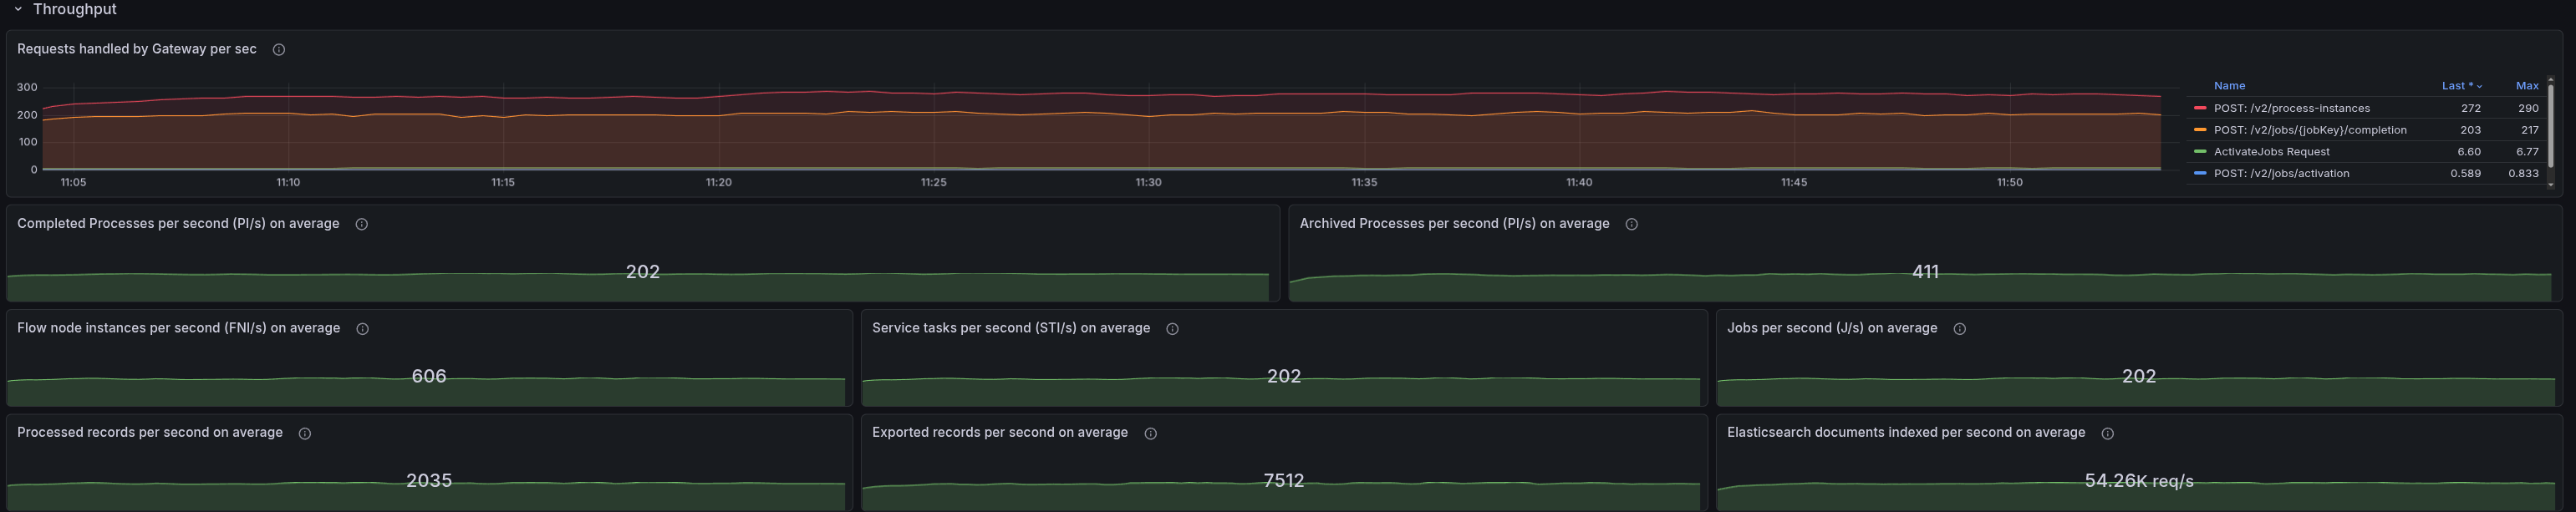
After the fix, the throughput is smooth and stable without any recurring drops:
Found Weaknesses / Learnings
- REST API usage causes higher CPU and memory usage on the client side
- REST API usage together with OIDC showed a recurring throughput drop pattern under high load, which was not visible with gRPC.
- This behavior was not reproducible with a lower load, so it seems to be related to the load we are pushing to the cluster.
- This was not related to the changes in 8.9, as it was also visible in 8.8, so it was an existing bug.
- In SaaS, we were not able to reach the same load as with our self-managed clusters, which prevented us from reproducing the same behavior as with our self-managed clusters.
- We have some observability gaps, as we were not able to see any back pressure from the server or client side when the gateway is overloaded. This is unexpected, as we are pushing more load than the cluster can handle.
- This might be related to the HTTP client we use, which might be saturated, but we need to investigate further to understand the root cause.
Further investigations
The recurring throughput drop under REST+OIDC has been fixed via #50124. The remaining open questions are:
- Investigate why REST API usage causes higher CPU and memory usage on the client side compared to gRPC, and whether this can be improved. #50382
- Improve measurement of request response times and back pressure to better identify bottlenecks under high load. #50383
Possible improvements for our load testing and reliability testing
As we experimented and used our load testing tooling, we identified several things we can improve:
- Rethink GitHub Workflow inputs for load test, where the description can be made more compact and readable. #50384
- Add a separate job output to print all the input values the user provided in the load test #50386
- Provide a user option to choose between OIDC/Basic and none #50387
- Fix the bug which causes issues when redeploying twice and replacing the client-secret #50388
- Improve logging of the starter and worker applications #50389