Reducing Optimize's Elasticsearch Overhead: Variable Filtering Strategies Compared

In a previous Chaos Day, we measured what Optimize costs a cluster: at a realistic workload, it drove 3.4x higher Elasticsearch (ES) CPU and ~4x more ES disk than running without it. That post ended with an open question: Can variable handling be tuned to reduce the impact? This Chaos Day answers it.
We ran twelve load tests on Camunda 8.9.9, six variable-filtering configurations, each at both a realistic and a max workload, and compared throughput, CPU, memory, and ES disk usage across all configurations. All twelve started together and ran in parallel on identical infrastructure and the same Helm chart, each started fresh with an empty Elasticsearch, so their footprints are directly comparable.
TL;DR; Keeping variables out of Optimize is the big lever. Disabling variable export (index.variable=false) cuts total Elasticsearch storage ~60% and ES CPU ~65% at a realistic load, and recovers ~15-20% throughput at max load. That is enough to give back essentially all the throughput Optimize was shown to cost in the previous Chaos Day, while keeping Optimize running. The surprising part: Optimize stores a variable ~14x more expensively than the raw Zeebe export does (≈29x for high-cardinality string variables), so the cost lives almost entirely in Optimize's imported indices, not in the export. And because in Camunda 8.9 the Elasticsearch exporter feeds only Optimize, this costs you Optimize variable analytics only: Operate and Tasklist (served by the Camunda Exporter) keep their variables untouched.
Chaos Experiment
All twelve clusters ran in parallel on the same benchmark infrastructure with orchestration-tag=8.9.9, the same camunda-platform-8.9 Helm chart (pinned to a single chart revision so index/replica settings are identical), and Optimize enabled everywhere. Each cluster started with an empty Elasticsearch so disk figures reflect only this run's accumulation, and all were started together so equal-age comparisons are valid.
All disk figures below are total store size (primary + replica) as reported by _cat/indices, which equals the real on-disk footprint and matches the cluster's filesystem-used metric. The benchmark runs 1 replica, so total ≈ 2x the primary-only figure; ratios are identical either way.
Configurations tested
Each configuration changes only how process variables are exported to Elasticsearch and/or imported by Optimize:

| Name | What it changes | Key setting |
|---|---|---|
| Baseline | Default, all variables exported and imported | (none) |
| Optimize mode | Exporter writes only what Optimize needs | zeebe.broker.exporters.elasticsearch.args.index.optimizeModeEnabled=true |
| Prefix filter | Only variables named customer* are exported | zeebe.broker.exporters.elasticsearch.args.index.variableNameInclusionStartWith[0]=customer |
| Importer off | Optimize skips importing variables (still exported to ES) | CAMUNDA_OPTIMIZE_ZEEBE_VARIABLE_IMPORT_ENABLED=false |
| Exporter variable off | No variable records exported at all | zeebe.broker.exporters.elasticsearch.args.index.variable=false |
| Exporter off + importer off | Both of the above (belt-and-suspenders) | index.variable=false + VARIABLE_IMPORT_ENABLED=false |
A note on the 8.9 architecture, because it shapes every result: the Elasticsearch exporter being tuned here feeds only Optimize (plus any custom data-ingestion pipeline a customer wires up). Operate and Tasklist get their data from the Camunda Exporter, a separate path. So all of these levers affect Optimize alone; Operate and Tasklist keep full variable data regardless. We confirm this empirically below.
Each configuration was run at two workloads, mirroring the previous post:
- realistic: a complex process model at a sustainable production rate (~1 PI/s), each instance carrying multiple tasks, sub-processes, and variables; representative of real customer workloads.
- max: driven at 300 PI/s to push the engine to its throughput ceiling and surface backpressure.
The two workloads use different variable payloads, which matters for the prefix filter:
- The realistic payload has 15 named variables, including three
customer-prefixed ones (customer,customerId,customer_claim_frequency) alongsidedisputeDetails,fraud_score_result, and others, so thecustomerprefix filter keeps a meaningful subset. - The max payload uses generic names (
var1…var14,businessKey) with nocustomer-prefixed variables, so thecustomerprefix filter matches nothing and behaves identically to disabling variable export. The prefix-filter result is therefore not comparable across the two workloads; at max load, it is effectively a second "exporter variable off" data point.
Validating the configuration at the data level
Before trusting the resource numbers, we confirmed that each configuration actually does what it claims. This means that the data landing in Elasticsearch reflects the filter. A terms aggregation on the Zeebe variable record index shows which variable names reached the zeebe-record ES indices:
curl -s -H 'Content-Type: application/json' \
  'localhost:9200/zeebe-record_variable*/_search' -d '{
    "size": 0,
    "track_total_hits": true,
    "aggs": { "names": { "terms": { "field": "value.name", "size": 50 } } }
  }'
Note:
The table below is just a snapshot of the data, after starting the load tests
| Configuration | Total Docs in zeebe-record_variable.* | disputeDetails | customer |
|---|---|---|---|
| Baseline | 11.4M | 16,001 | 1,615,967 |
| Optimize mode | 11.5M | 16,114 | 1,627,390 |
Prefix filter (customer) | 1.67M | 0 | 1,637,615 |
| Importer off | 11.5M | 16,164 | 1,632,452 |
| Exporter variable off | 0 | 0 | 0 |
| Exporter off + importer off | 0 | 0 | 0 |
This confirms the filters at the data level: exporter variable off writes no variable records; the prefix filter drops every non-customer variable (disputeDetails = 0) while keeping customer*. The importer off / optimize mode leaves the full variable stream in the exported indices (with its effect downstream in Optimize's own indices).
Expected
We expected that configurations that remove variable data to reduce ES disk and CPU usage would yield the deepest cuts, with variables never reaching ES at all.
Open questions have been: how much does each actually save, whether disabling only the Optimize importer (variables still exported) saves storage, and whether any of this recovers throughput at max load.
Actual
Realistic workload: where the storage goes
At a realistic workload, throughput is unconstrained (all six held ~1 root PI/s + 50 sub-process instances with zero backpressure), so the differences land entirely in Elasticsearch.

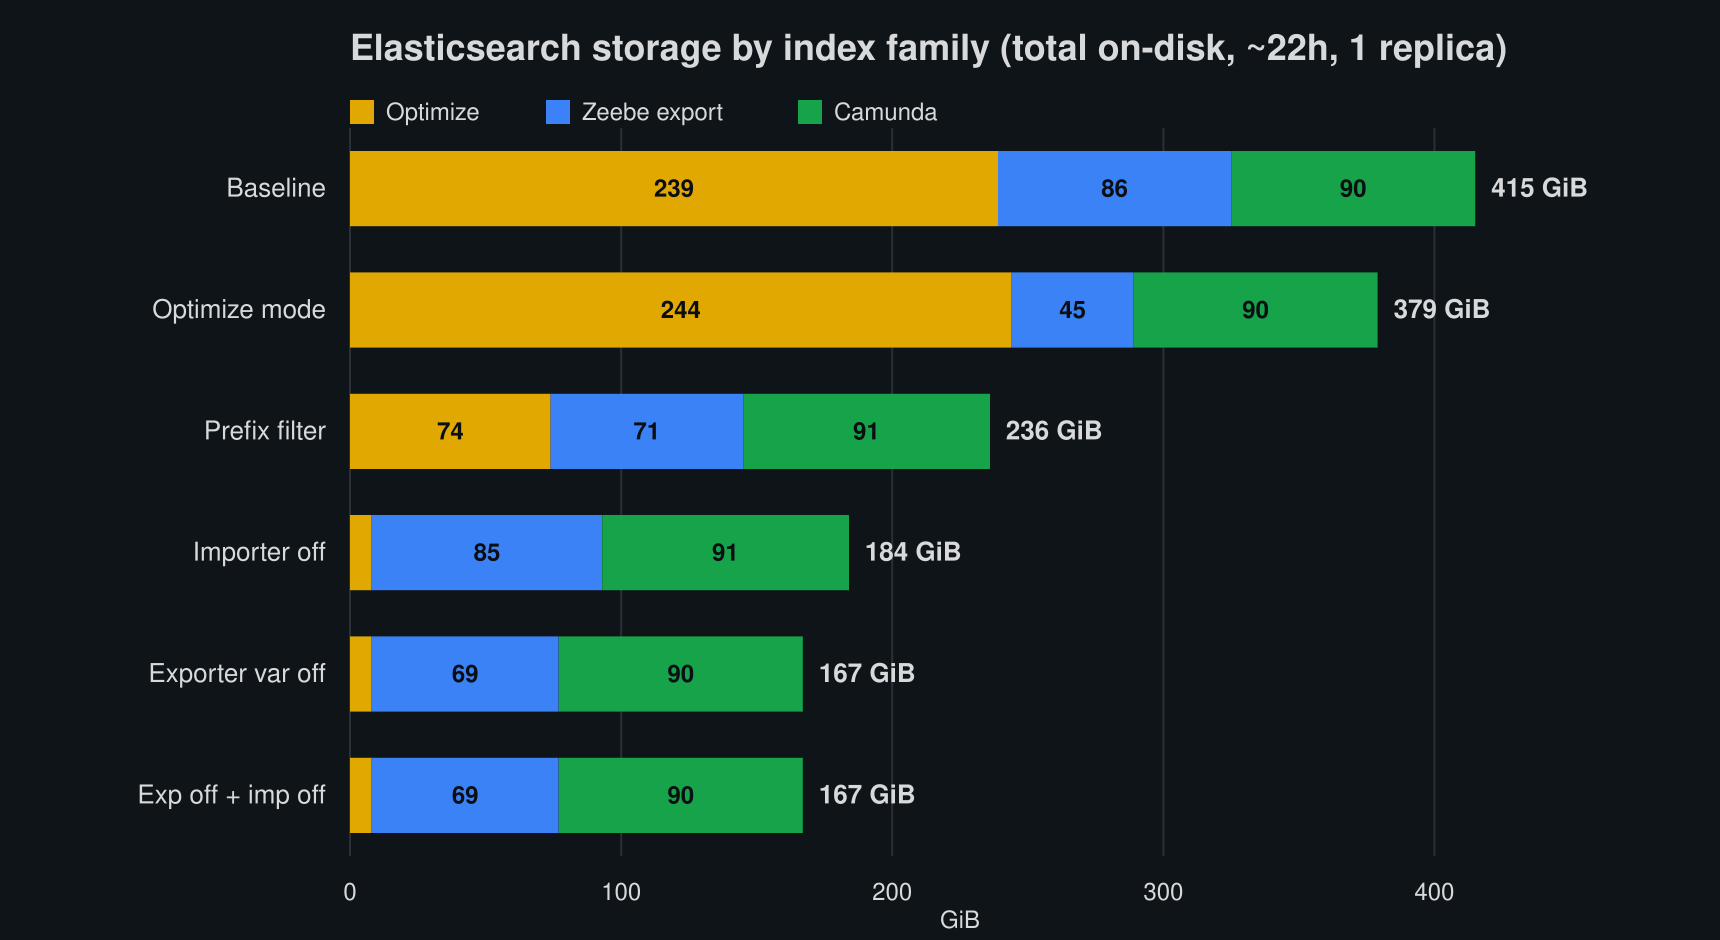
Breaking total ES storage into three families makes the picture clear: Optimize (optimize-*, the ES exporter indices' only consumer), Zeebe export (zeebe-record*, the raw record exporter output), and Camunda (operate-* + tasklist-* + camunda-*, written by the independent Camunda Exporter):
| Configuration | Optimize | Zeebe export | Camunda | Total | vs base |
|---|---|---|---|---|---|
| Baseline | 239 | 86 | 90 | 415 GiB | 0% |
| Importer off | 8 | 85 | 91 | 184 GiB | -56% |
| Prefix filter | 74 | 71 | 91 | 236 GiB | -43% |
| Exporter variable off | 8 | 69 | 90 | 167 GiB | -60% |
| Exporter off + importer off | 8 | 69 | 90 | 167 GiB | -60% |
| Optimize mode | 244 | 45 | 90 | 379 GiB | -9% |
Three things stand out:
- The Optimize index is the whole story. It is ~58% of baseline storage, and removing variables (by import or export) collapses it from 239 GiB to ~8 GiB, a 97% cut. Everything else barely moves.
- The Camunda bucket is flat at ~90 GiB across every configuration, including
exporter variable off. That is the proof of the architecture note above: Operate/Tasklist variables come from the Camunda Exporter and are completely untouched by these levers. - Importer-off and exporter-off are nearly identical (184 vs 167 GiB). Both kill the Optimize cost; the ~17 GiB difference is just the variable records that importer-off leaves sitting in the Zeebe exported indices.
Optimize stores variables 14-29x more expensively than the export
The most interesting result is the amplification. The same variables that occupy a modest slice of the raw export balloon in Optimize's nested representation:
- All variables: Removing them shrinks Optimize by 231 GiB (239 → 8) but removes only ~17 GiB of Zeebe variable records. This means we have an ~14x amplification (231 ÷ 17) of the variable footprint in Optimize vs the raw export.
customer*string variables: The prefix filter keeps onlycustomer*variables: that is +2.3 GiB in the Zeebe exported indices, but +66 GiB in Optimize (74 vs 8), an amplification of ~29x.
In other words, the lever that matters is keeping variables out of Optimize; trimming the export alone barely dents the total.
The Optimize-mode result leaves the Optimize index essentially unchanged (244 vs 239 GiB) but halves the Zeebe export (86 → 45 GiB). Those ~41 GiB it strips are job records that Optimize never imports: pure dead weight in an Optimize-only export, but irrelevant to the Optimize index itself. This is worth enabling by default, since it has no negative impact on Optimize features.
Realistic workload: CPU and memory
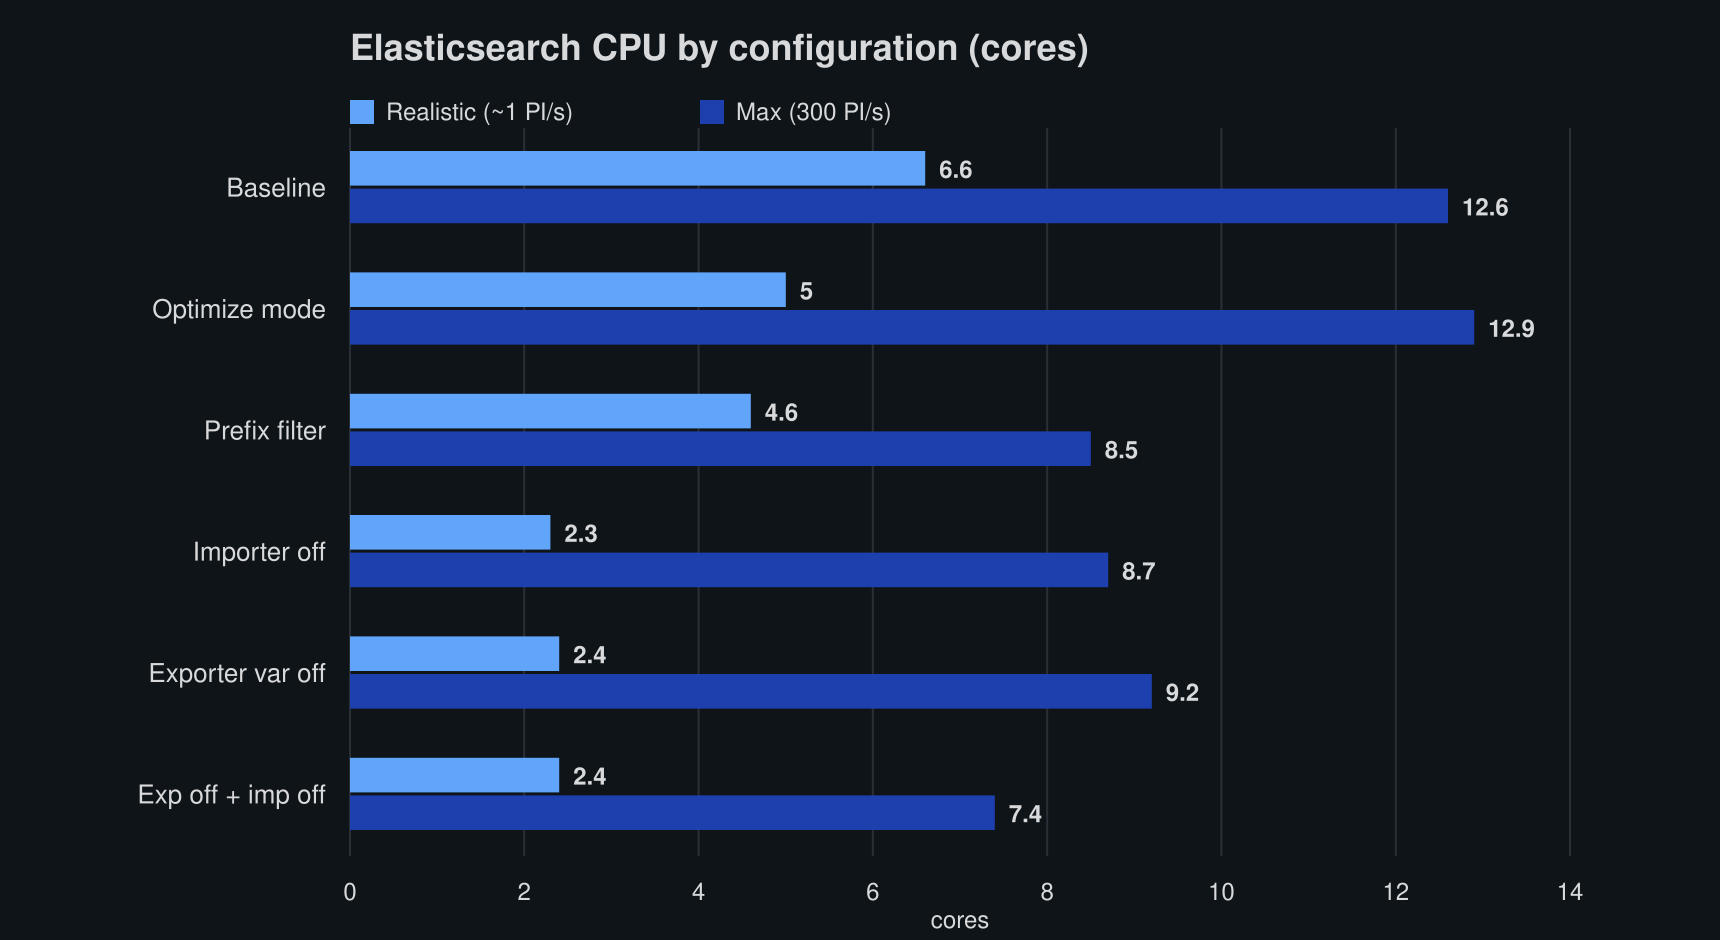
ES CPU tracks the storage story almost exactly (the chart above shows both workloads; the max bars are discussed below):
| Metric (cores) | Baseline | Optimize mode | Prefix filter | Importer off | Exporter var off | Exp off + imp off |
|---|---|---|---|---|---|---|
| ES CPU | 6.6 | 5.0 | 4.6 | 2.3 | 2.4 | 2.4 |
| Camunda CPU | ~4.5 | ~4.4 | ~5.5 | ~4.2 | ~3.9 | ~4.9 |
Removing variables from Optimize cuts ES CPU by ~65% (6.6 → ~2.4 cores). Camunda broker CPU is unaffected: it sits around 4-5 cores regardless. Variable filtering is purely an Elasticsearch-side lever. ES (and total) memory was likewise flat (~13-15 GiB ES) across all six, likely because the JVMs simply preallocate the memory.
Max workload: throughput and backpressure
At 300 PI/s, the clusters are throughput-constrained, so the question becomes which configuration sustains the most completed instances by freeing Elasticsearch write capacity.

| Metric | Baseline | Optimize mode | Prefix filter | Importer off | Exporter var off | Exp off + imp off |
|---|---|---|---|---|---|---|
| Completed PI/s | 225 | 250 | 249 | 240 | 261 | 239 |
| Dropped req/s (backpressure) | 416 | 318 | 345 | 374 | 267 | 379 |
The robust signal: baseline is consistently the worst (~205-225 PI/s with the highest backpressure across every sample), and configurations that keep variables out of the export sustain ~15-20% more throughput. The fine ranking among the variable-reduced configs falls within run-to-run/noisy-neighbor variance (±~20 PI/s), so we don't read precise positions into it. For example, Optimize mode read 250 PI/s in this sample but 207 in another, so we make no throughput claim for it.
One subtlety worth calling out: at max load, only export-side removal recovers throughput. Importer-off barely helps (240 vs 225) because it leaves the export write load unchanged, and at max load, the Zeebe-to-Elasticsearch write path is the bottleneck, not Optimize's downstream import.
This gives back the throughput Optimize costs. The previous Chaos Day measured that penalty by toggling Optimize on and off at max load: 214 PI/s with Optimize vs 274 without, a 22% loss. Here, baseline (Optimize on, all variables) sits at ~225 PI/s, matching that "with Optimize" figure, and exporter-var-off reaches ~261, back at the no-Optimize level (within run-to-run noise). The striking part: var-off keeps Optimize enabled and still imports process data, yet recovers nearly all the lost throughput. So Optimize's max-load penalty was almost entirely variable handling, not Optimize itself. It also confirms the previous post's proposed mechanism: the extra ES write pressure that made the exporter lag was the variable data.
On resources, the ES CPU chart above tells the max story too: the variable-reduced configurations run cheaper (~7-9 cores) than baseline and Optimize mode (~13 cores), and they do so while sustaining higher throughput, so the lever wins on both axes at once.
Note:
We deliberately don't show a max-load storage breakdown: at 300 PI/s, each configuration completes a different number of instances, so the Zeebe and Camunda index sizes there reflect differing throughput rather than the variable setting. Only the equal-rate realistic decomposition above is a clean apples-to-apples comparison.
Configuration Guide / Recommendations
For each knob: what it controls, the measured effect, and when to use it. (Storage figures are total on-disk at a realistic load; all of them touch Optimize only, Operate, and Tasklist keep their variables.)
- Optimize mode (
optimizeModeEnabled=true): recommended default. It is not a variable-storage lever (Optimize index unchanged, -9% total), but it strips ~41 GiB of Zeebe records that the Optimize importer doesn't read. This doesn't affect any Optimize feature and is useful when no other custom application consumes the remaining Zeebe record indices. - Exporter variable off (
index.variable=false): recommended when no variable analytics are needed. Variables are never written to the Optimize-facing exported indices. Total ES storage -60%, Optimize index -97%, ES CPU -65%, and ~15-20% more throughput at max with the lowest backpressure. Trade-off: Optimize loses variable-level analytics. Use whenever Optimize doesn't need variable data. - Importer off (
CAMUNDA_OPTIMIZE_ZEEBE_VARIABLE_IMPORT_ENABLED=false): same effect on the Optimize index (-97%), slightly less total saving (-56%, the export keeps the variable records), and it does not recover max throughput, since we still export the variables. Use when you still want the raw variable records in the export (e.g., a custom pipeline) but want to spare Optimize the storage. - Exporter off + importer off: recommended when no variable analytics are needed. Belt-and-suspenders; behaves like exporter-off (-60%). With no exported variable records, there is nothing for the Optimize importer to check on its side.
- Prefix filter (
variableNameInclusionStartWith): a tunable middle ground (-43% total, -72% Optimize index here), scaling with how much of the payload matches. Use when a bounded, named set (e.g.,customer*) carries the analytics value, and the rest is noise. It is a helpful option for customers who want to keep some variables in Optimize but not all. Note that the prefix filter is applied export-side.
What We Learned
- The Optimize index is where variables cost you. It is ~58% of baseline ES storage. Removing variables from import or export cuts it ~97% (239 → 8 GiB) and ES CPU ~65%, with throughput improvements at maximum load on top.
- Optimize amplifies variable storage ~14x over the raw export (≈29x for high-cardinality string variables), so trimming the export alone barely helps; the variables must be kept out of Optimize.
- Importer-off ≈ exporter-off for storage, but only export-side removal recovers throughput at max load (the exporter write path is the max-load bottleneck).
- Exporter-var-off gives back the throughput Optimize costs. It reaches ~261 PI/s vs baseline ~225, back at the previous post's no-Optimize level (274), while Optimize stays enabled. Optimize's ~22% max-load penalty was almost entirely variable handling.
- Optimize mode reduces noise. It shrinks the exported indices (job records) to the subset Optimize needs, without impacting Optimize features. It is a good default for customers who don't need the full Zeebe record export.
- Tested configurations only affect Optimize. The Camunda Exporter keeps Operate/Tasklist variables intact (~90 GiB, flat across all configs). Camunda broker CPU and memory are unaffected; this is an Elasticsearch-side lever.
Possible Improvements / Recommendations
- Update the sizing guidance with these concrete variable-filtering numbers (camunda-docs#9118).