Full-disk due to soft-pausing exporters


On today's Chaos Day, we wanted to experiment with disks filling up due to soft-paused exporters. We have recently encountered some incidents in which these disks filled up. We wanted to understand how Zeebe behaves in such scenarios. We had the following experiment planned: reproducing full disks because exporters are not confirming positions (due to soft-pausing).
TL;DR: We were able to reproduce the full-disk scenario with soft-pausing exporters. The node becomes unresponsive and rejects requests. After unpausing the exporters, we were able to free up disk space again, but it took a while because the exporters needed to re-export all unacknowledged records after the restart. Some interesting learnings from this experiment are that we should not keep exporters soft-paused for long. This can be especially problematic if nodes get restarted. When the disk is full, backpressure still reports zero, but all requests are rejected. Even REST requests are no longer successful.
Chaos Experiment
In this experiment, we want to understand how Zeebe behaves when the disk is full due to an Exporter that is not exporting. This can happen when backups have been taken, but exporters haven't been resumed.
The idea is to set up a realistic load test, pause the exporters, fill the disk, restart the node (for maximum impact), and then resume the exporters to see if the node can recover and reclaim the disk space by clearing the log.
We will make use of the soft-pause feature:
Soft pause exporting is a feature that allows you to continue exporting records from Zeebe, but without deleting those records (log compaction) from Zeebe. This is particularly useful during hot backups.
Expected
We expected that once the disk filled, the node would become unresponsive, leading to timeouts and increased request processing latency. However, once we resume the exporters, we expected the node to clear the log and reclaim disk space, allowing it to come back to life and resume normal operations.
Actual
We have set up a new realistic load test using the c8-chaos-full-disk namespace, and we are using the 8.9.9 image as the last stable release.
After observing the system under load, we soft-paused the exporters using the management API.
kubectl port-forward svc/camunda 9600:9600 -n c8-chaos-full-disk &
sleep 5
curl -X POST http://localhost:9600/actuator/exporting/pause?soft=true
{"body":null,"status":204,"contentType":null}
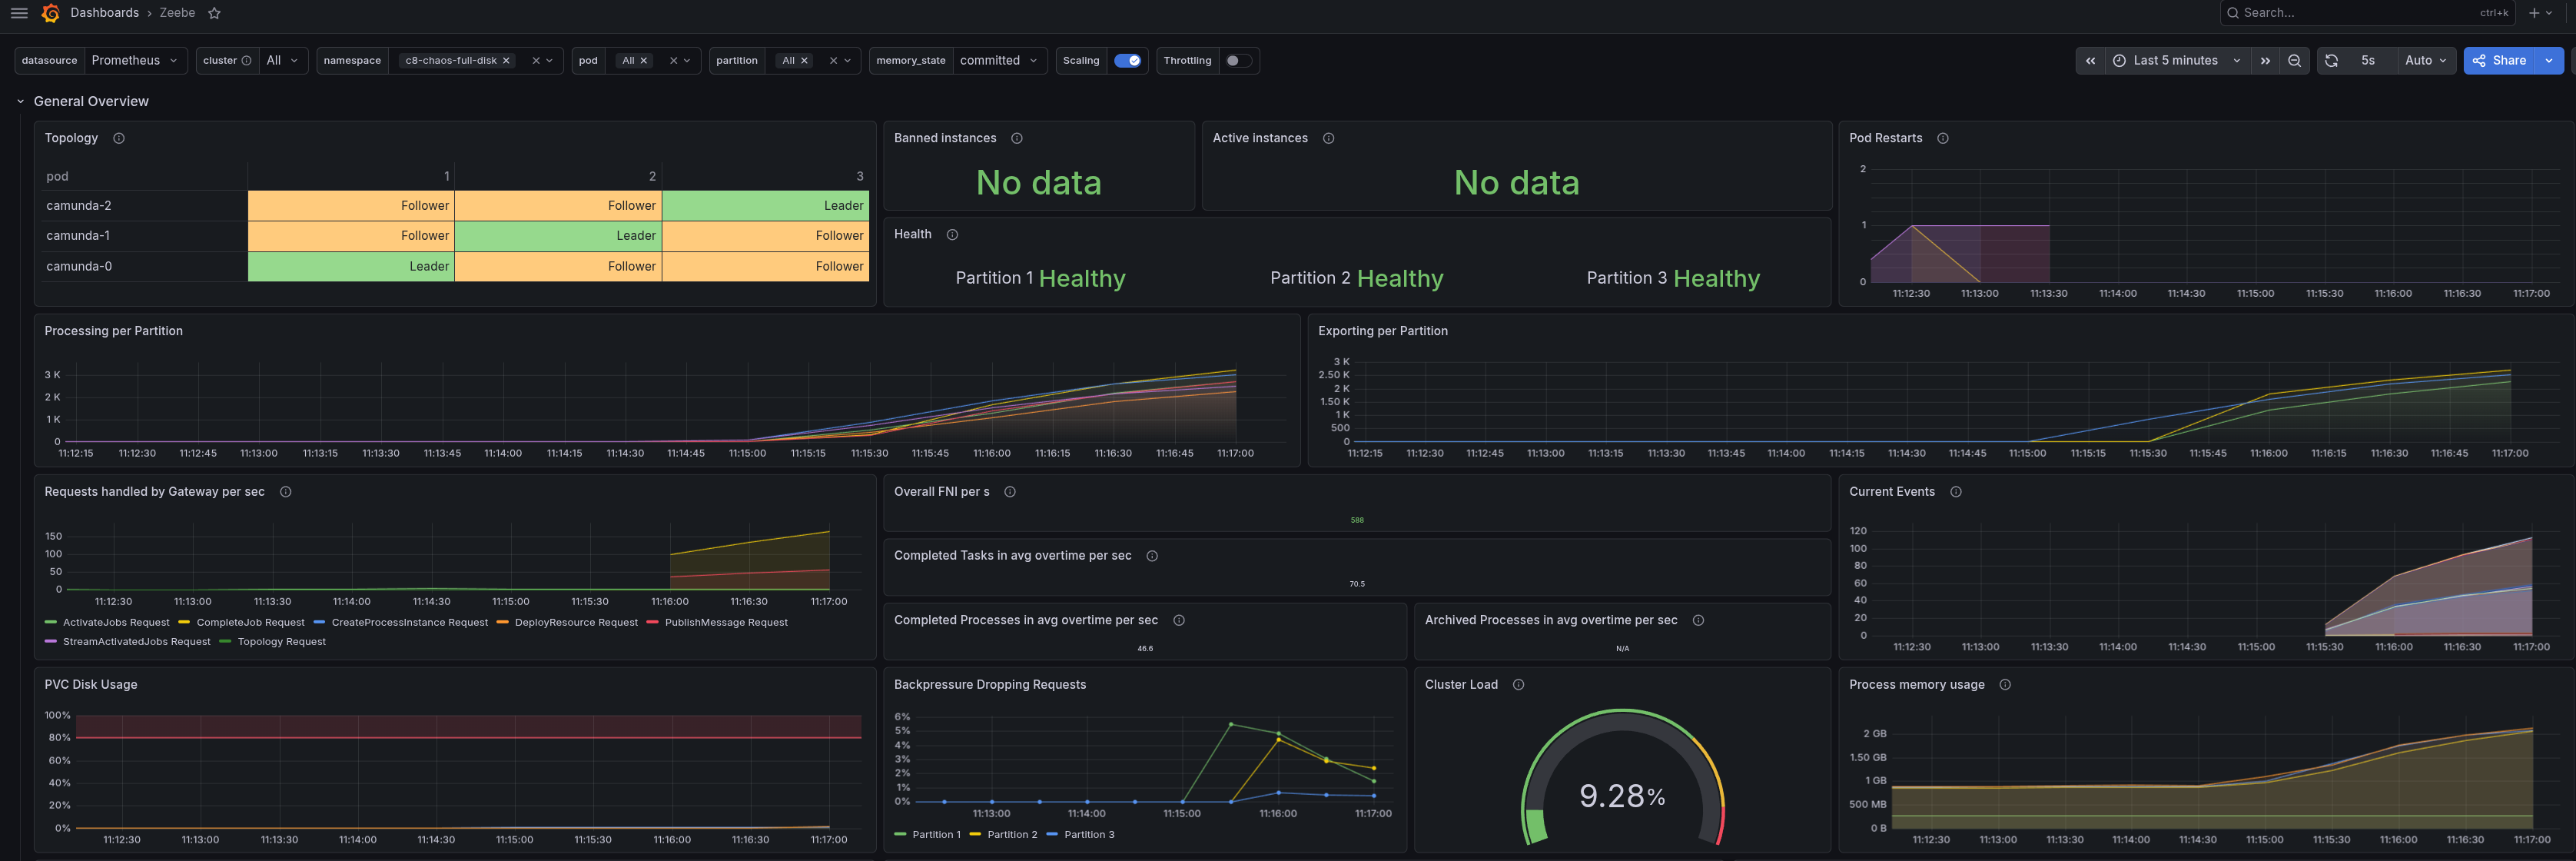
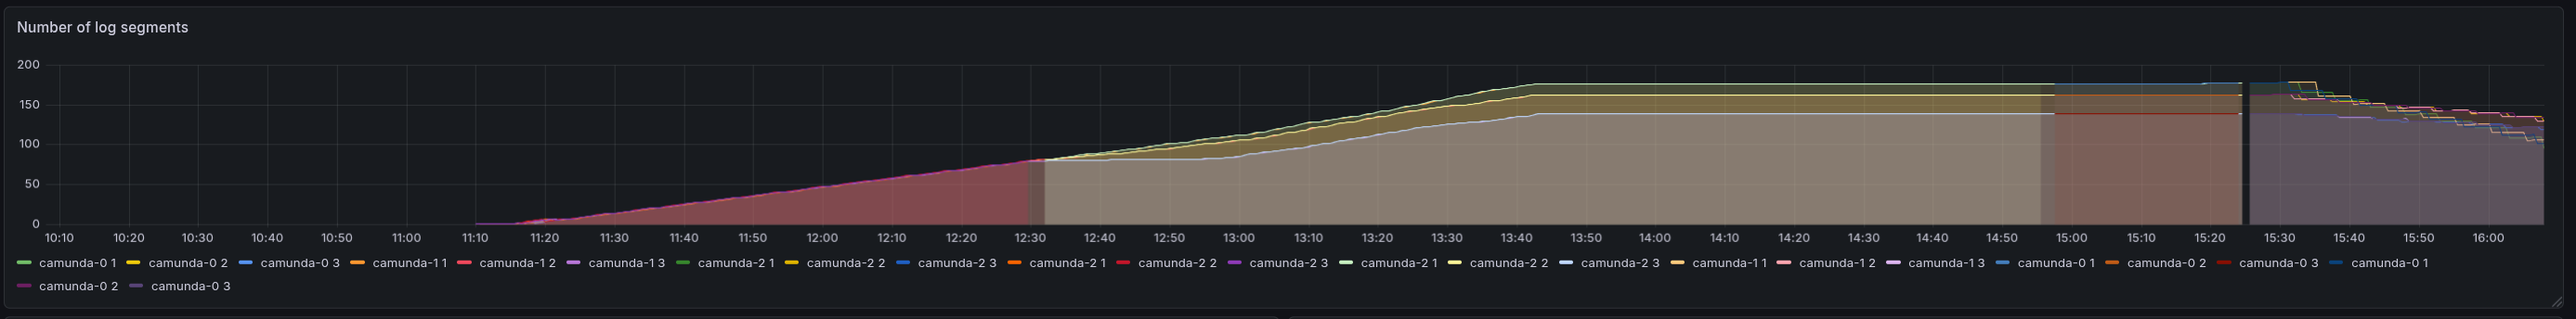
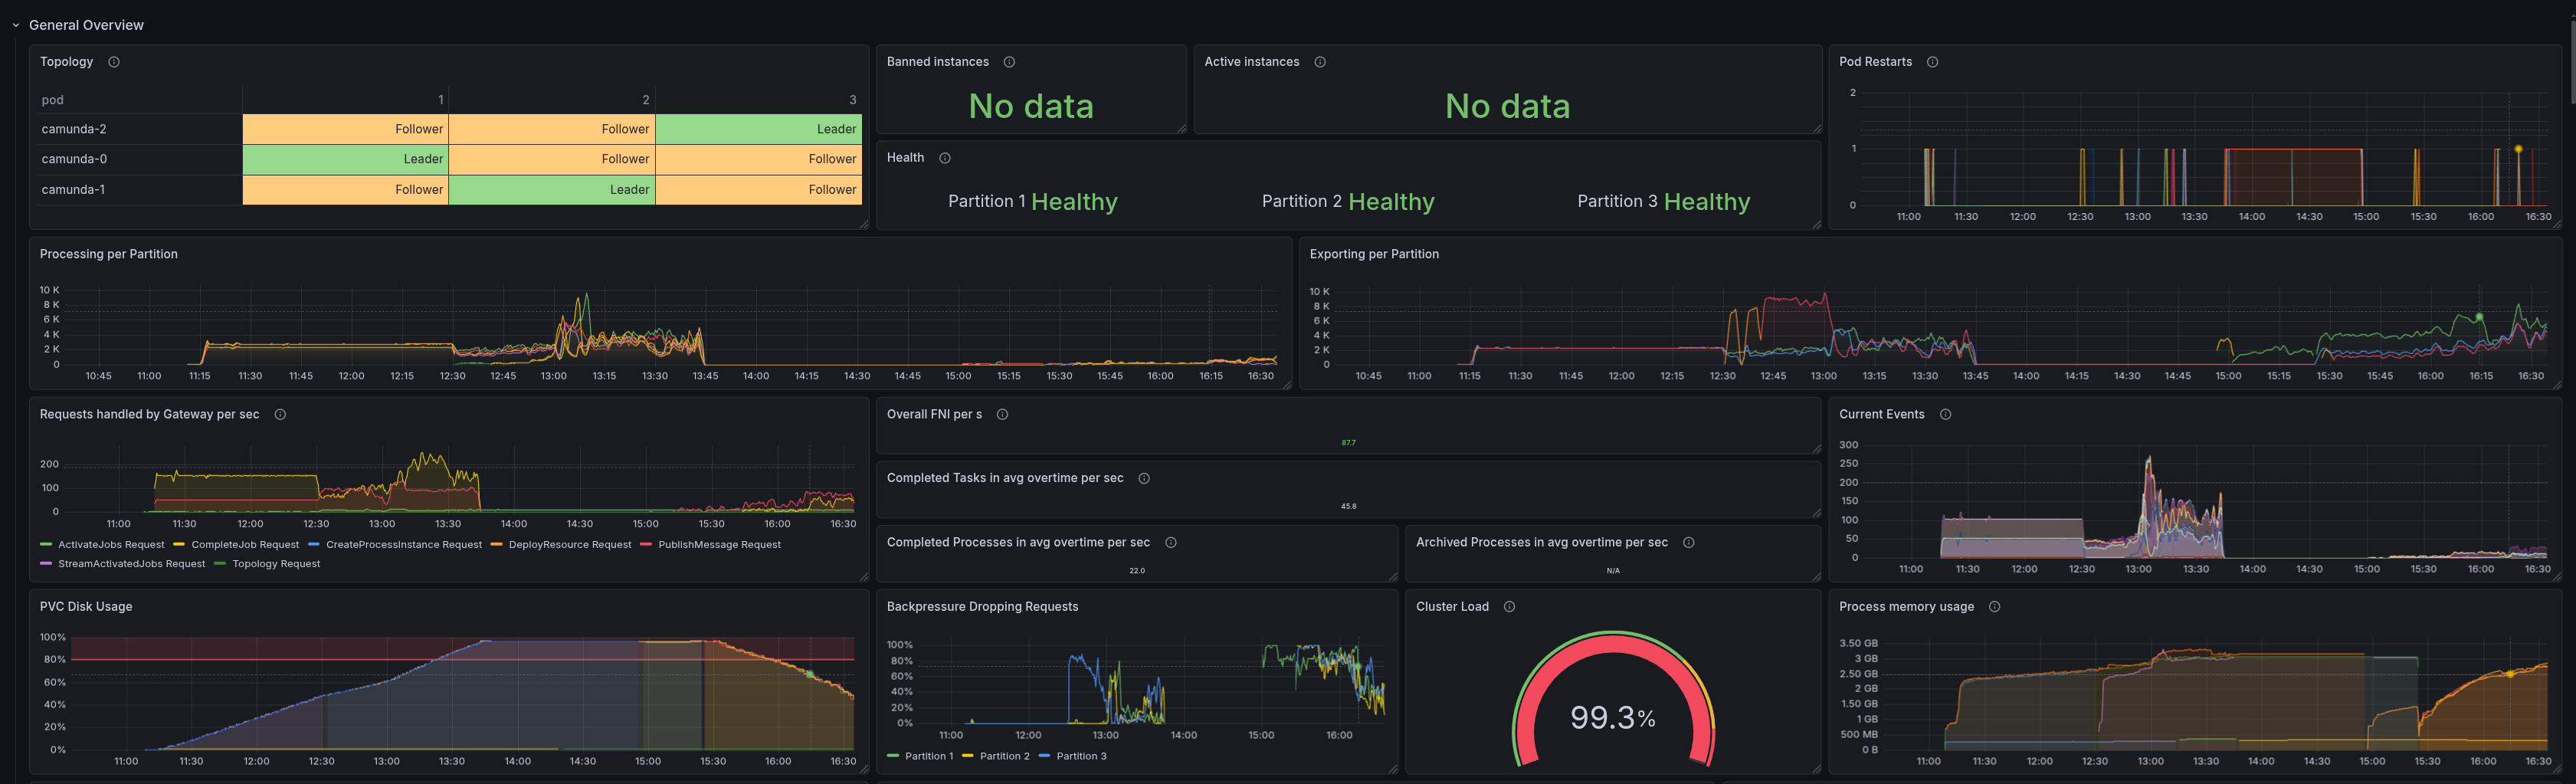
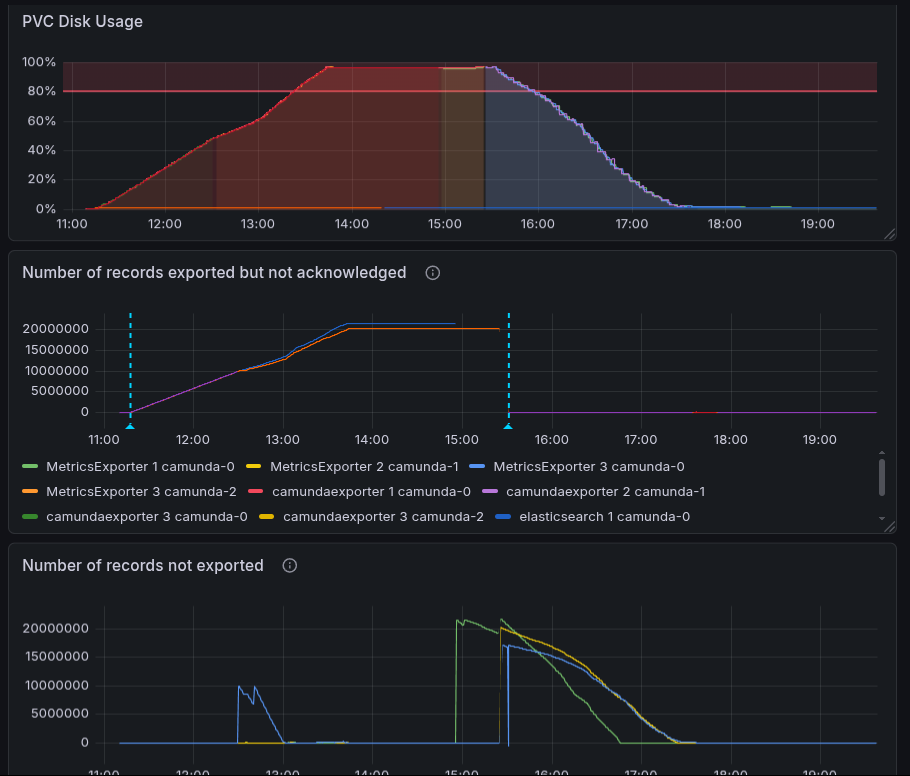
Soft-pausing allows the exporter to continue exporting without confirming positions, which means that the log will continue to grow until the disk is full. This is normally used during backups. We observed that the log was growing and the disk usage was increasing as expected.
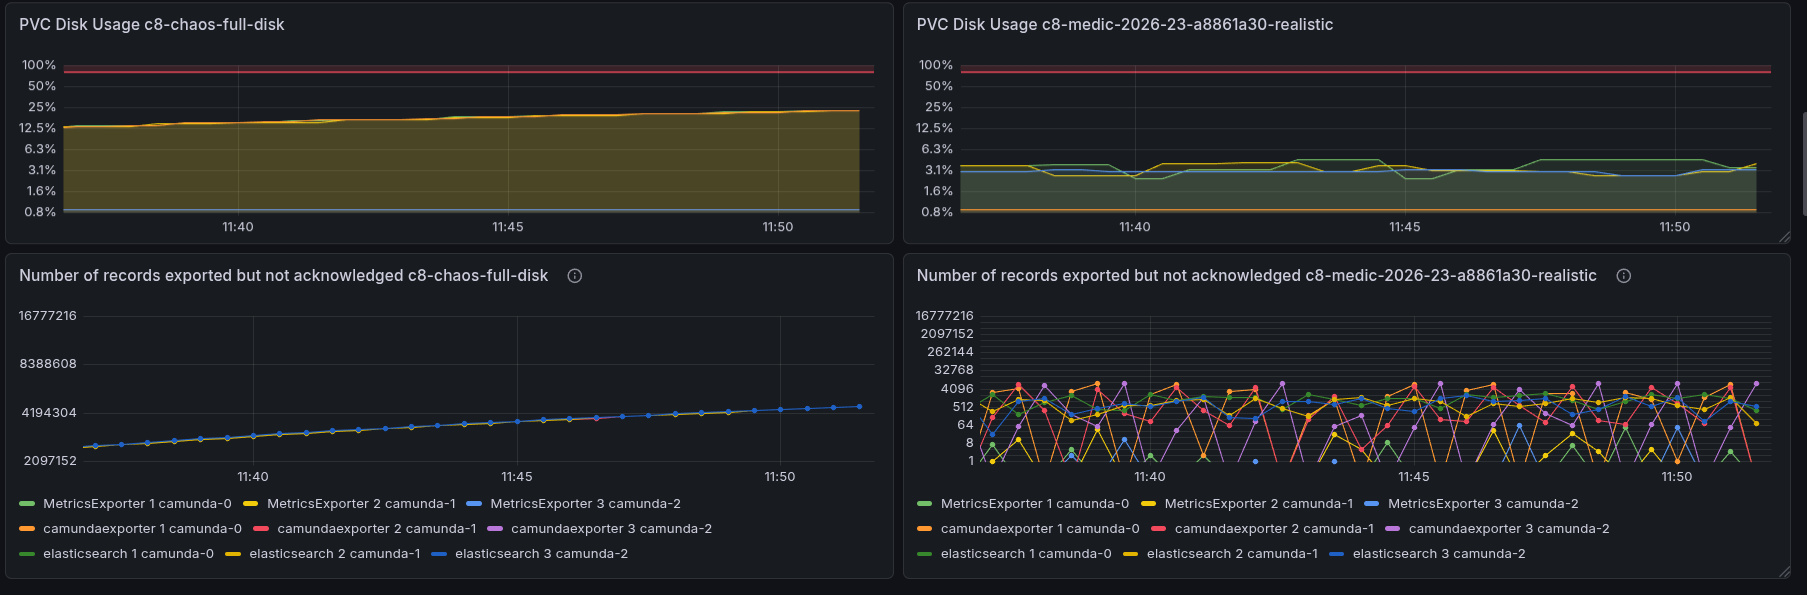
To compare disk usage, we used one of our weekly load tests as a baseline. We can see that disk space usage is constant, while the number of records exported and acknowledged fluctuates between 0 and ~4k. By pausing the exporter, we see a large spike in unacknowledged positions.
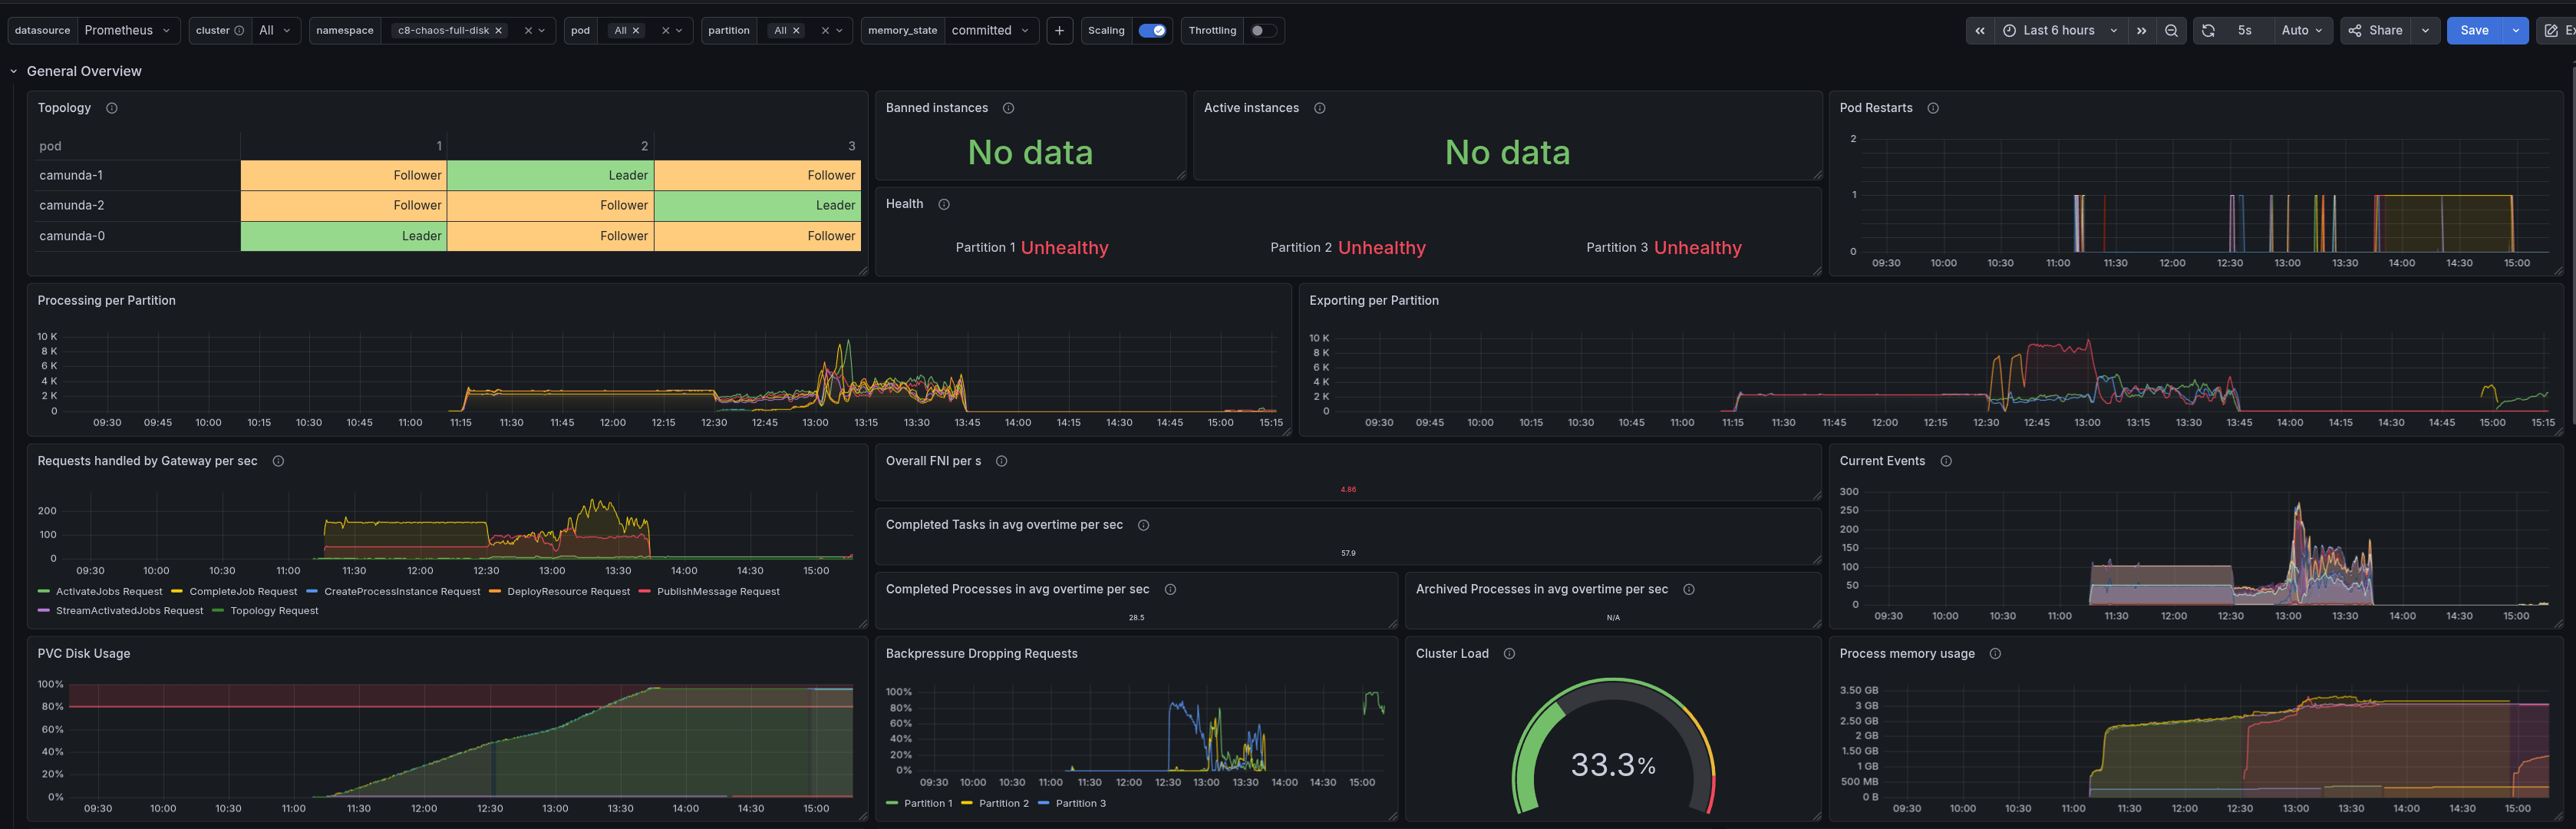
After reaching the disk capacity, we can see how requests and processing stop. What is interesting is that the backpressure metric itself is 0, as no requests are counted as coming in (they are rejected directly by the node). The client itself doesn't log that much, as RESOURCE_EXHAUSTED errors are mostly not logged.
Note:
This is something we should improve, as it might be hard to understand that the node is rejecting requests because of a full disk, but the backpressure metric is 0. Tracked in camunda/camunda#55510.
In the gRPC metrics, we can see that the node is rejecting requests.
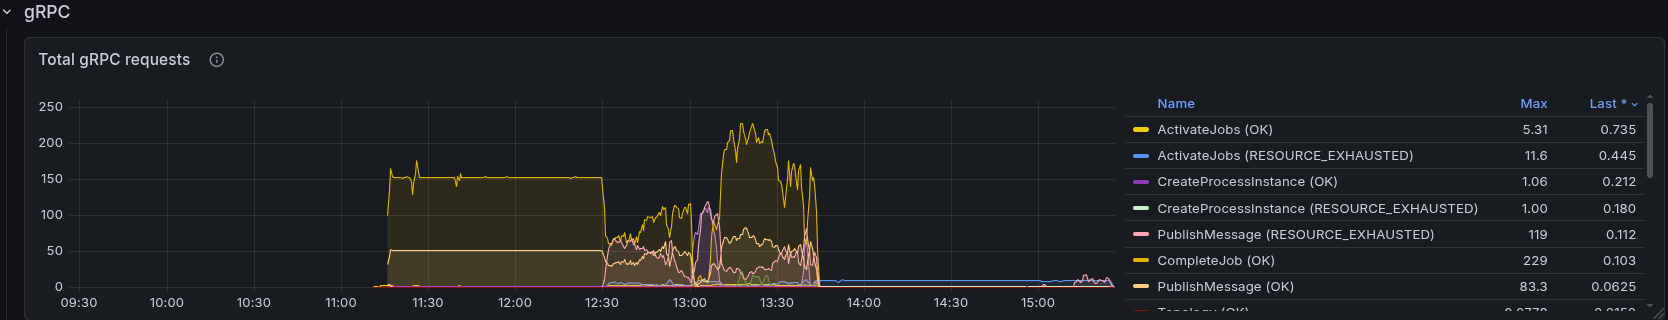
The starter is not successfully sending requests.
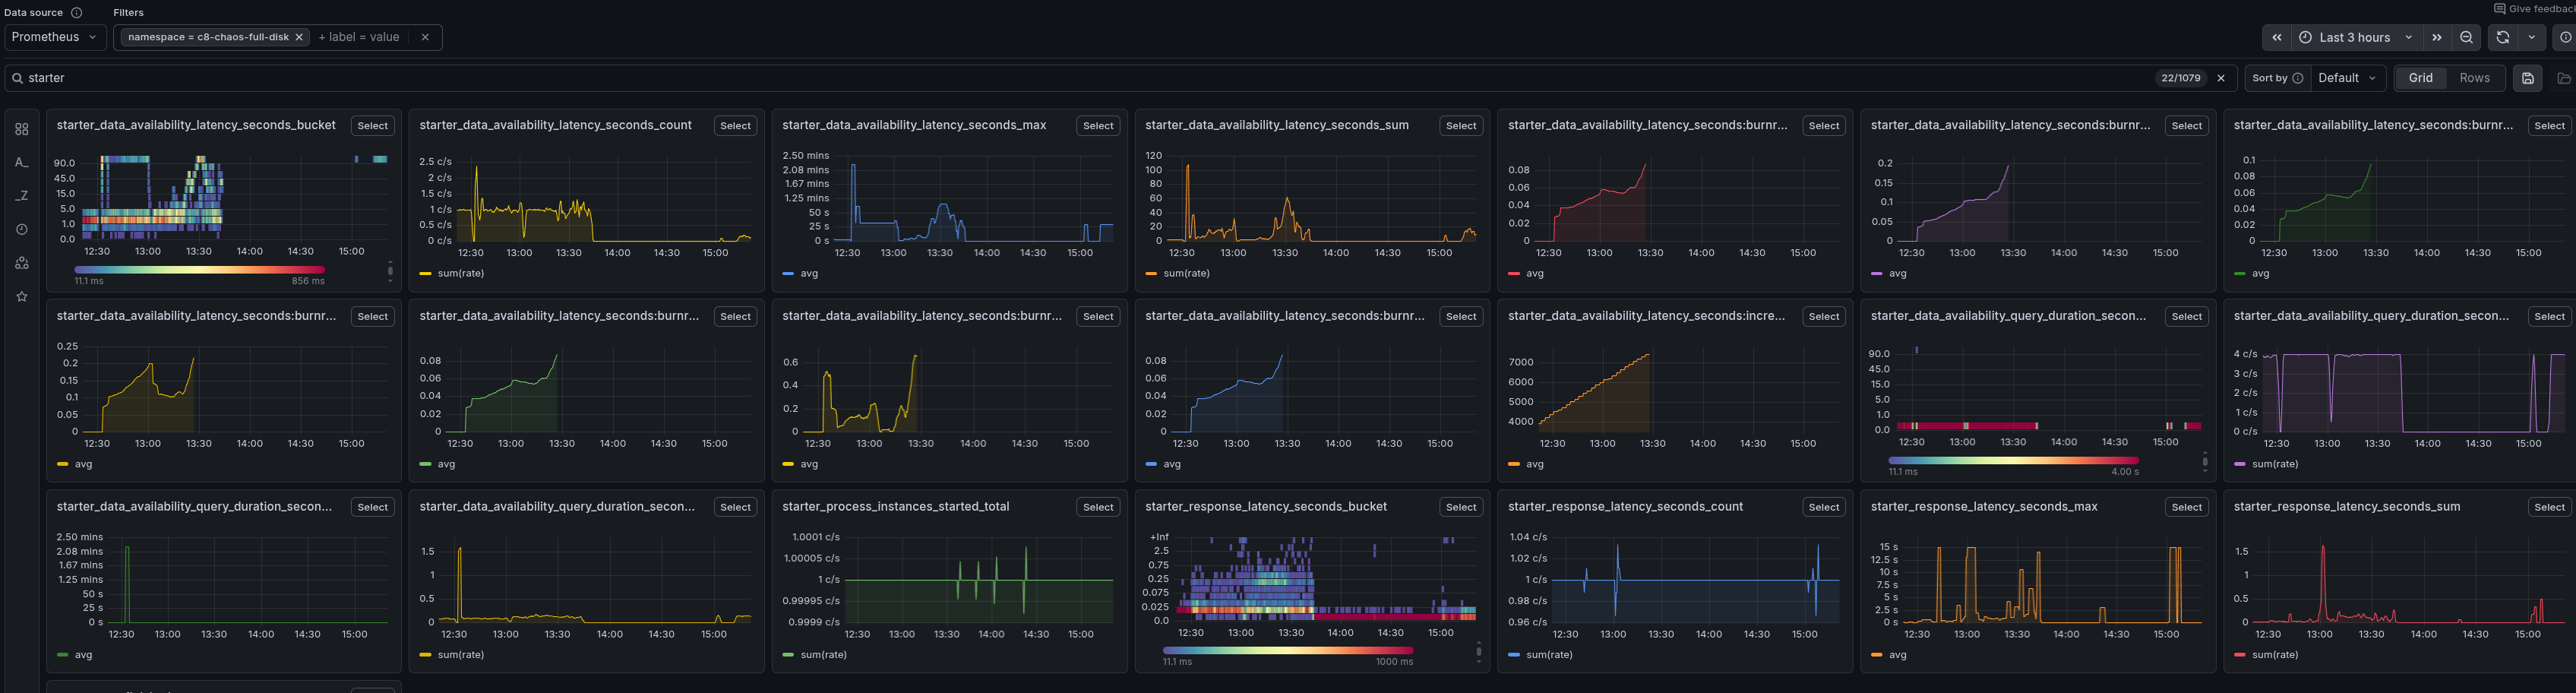
Even REST query requests are not successful, which is unexpected, as we do not need to write to disk or process them. This impacts the data availability metric.
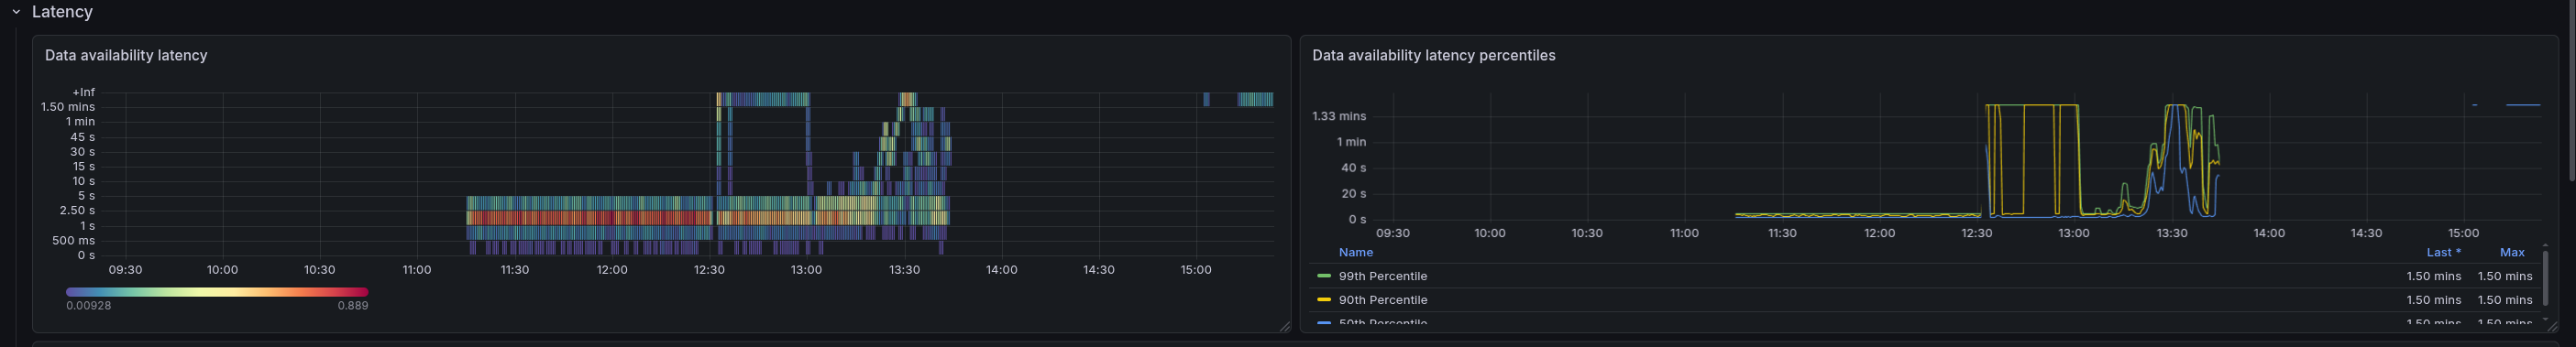
Note:
We should investigate further why REST requests stop, as it should still be possible to query data from the secondary storage. This also means web components like Operate become unavailable during a full-disk condition. Tracked in camunda/camunda#55511.
After reaching the full disk, we restarted the cluster. This is not so unlikely to happen in real life: if the node becomes unresponsive, an operator might try to restart it. We wanted to see what happens in this case.
kubectl delete pod camunda-0 camunda-1 camunda-2
After the restart, resume the exporters via:
kubectl port-forward svc/camunda 9600:9600 -n c8-chaos-full-disk &
sleep 5
curl -X POST http://localhost:9600/actuator/exporting/resume
{"body":null,"status":204,"contentType":null}
We can see that disk space usage is slowly decreasing as the exporters begin to acknowledge the records, and the log is cleared. But it takes a while.
What was surprising for us was that it did not take effect immediately, and we were not able to reclaim the space directly. This can be especially seen in the exporter positions. After the restart, we see a HUGE spike in not-exported records.
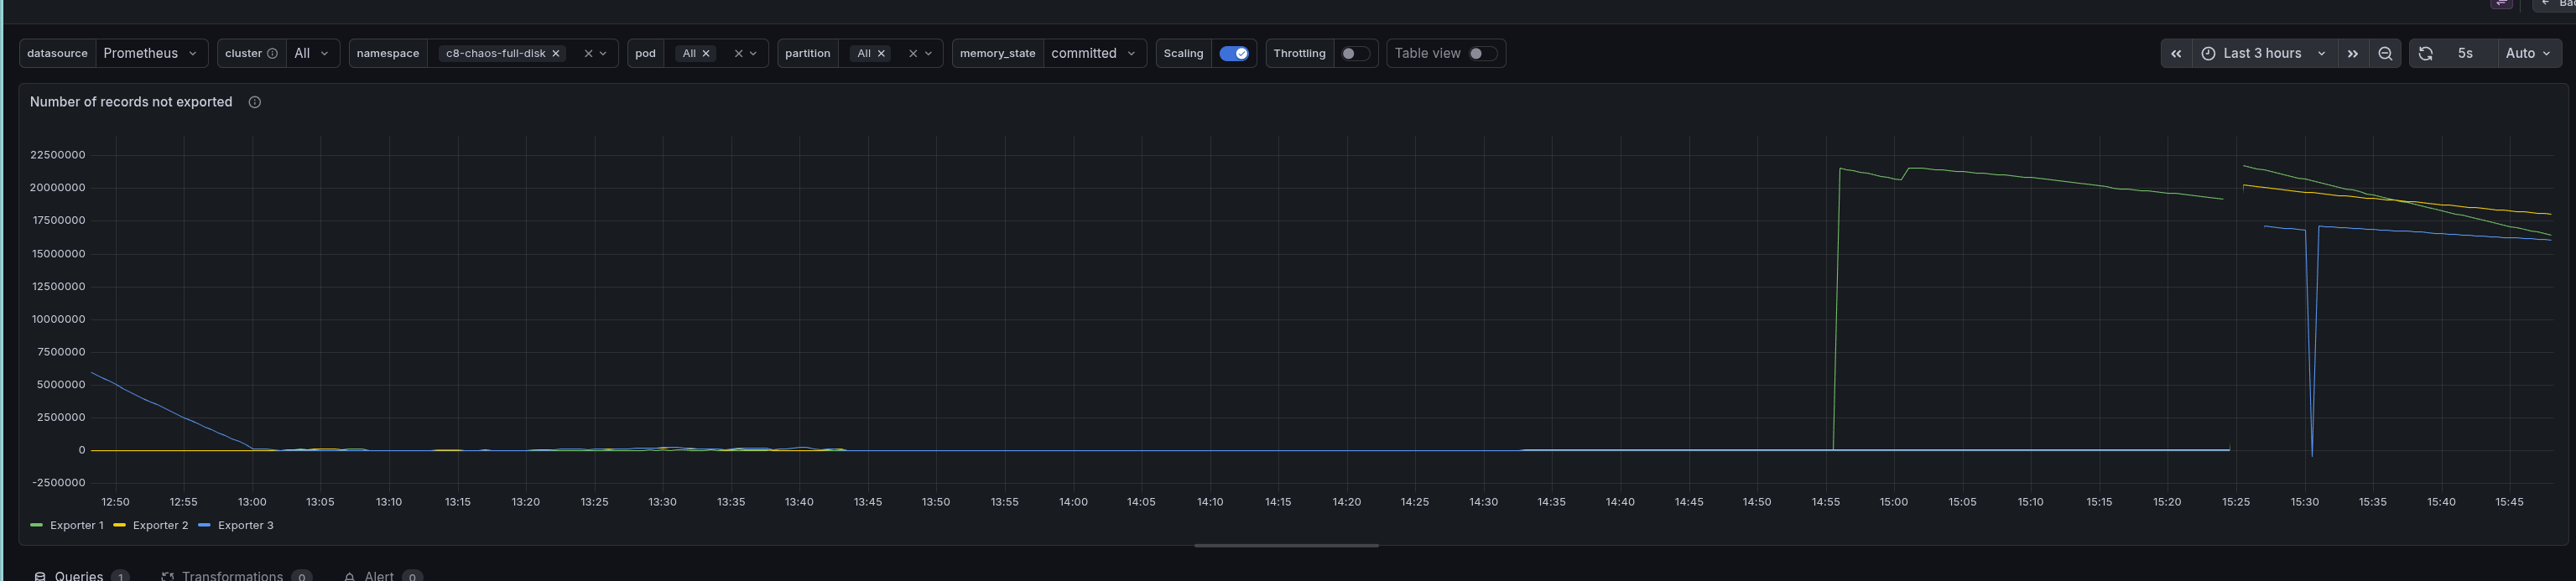
We realized that the reason for this is that after a restart, the exporters need to export from the position they have last acknowledged. This is before the soft-pausing. Only after they are re-exported and the records are acknowledged can the corresponding log be cleared. This means that if we have a large backlog of records in the log, it can take some time for the exporters to catch up and for the log to be cleared.
This is especially important to not keep soft-pausing for a long time.
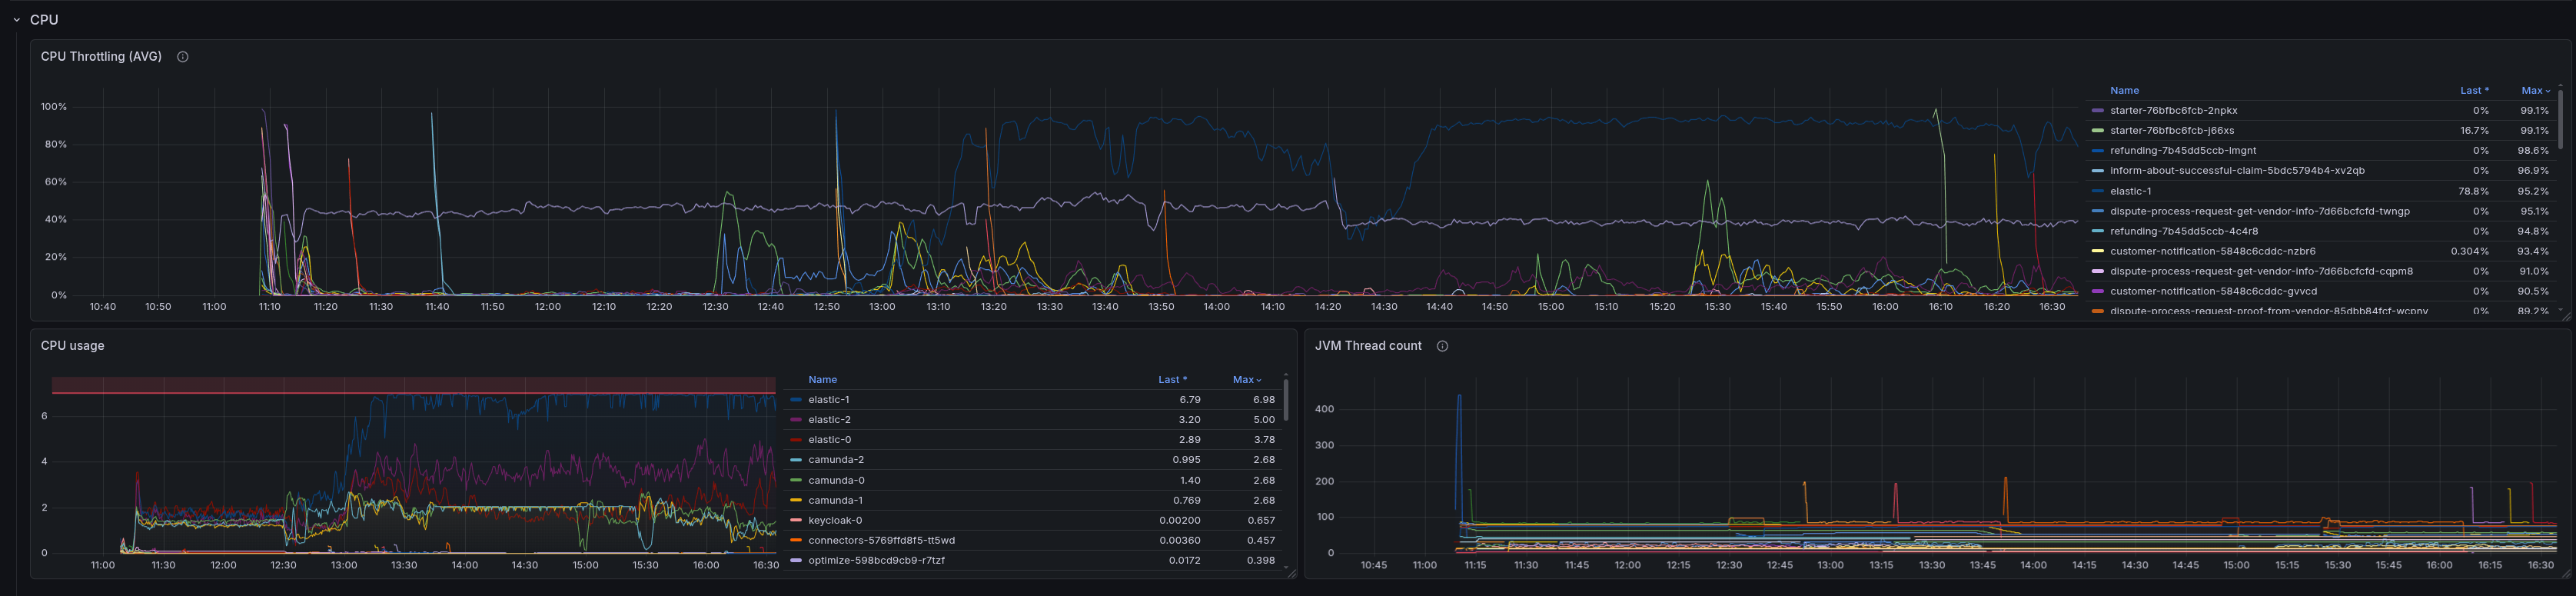
The whole process of re-exporting all the data can be especially evident in Elasticsearch's high stress as it has to index a large number of documents again.
After reclaiming some disk space, the node becomes responsive again, and we can see that the backpressure metric is reporting, and requests are being processed again.
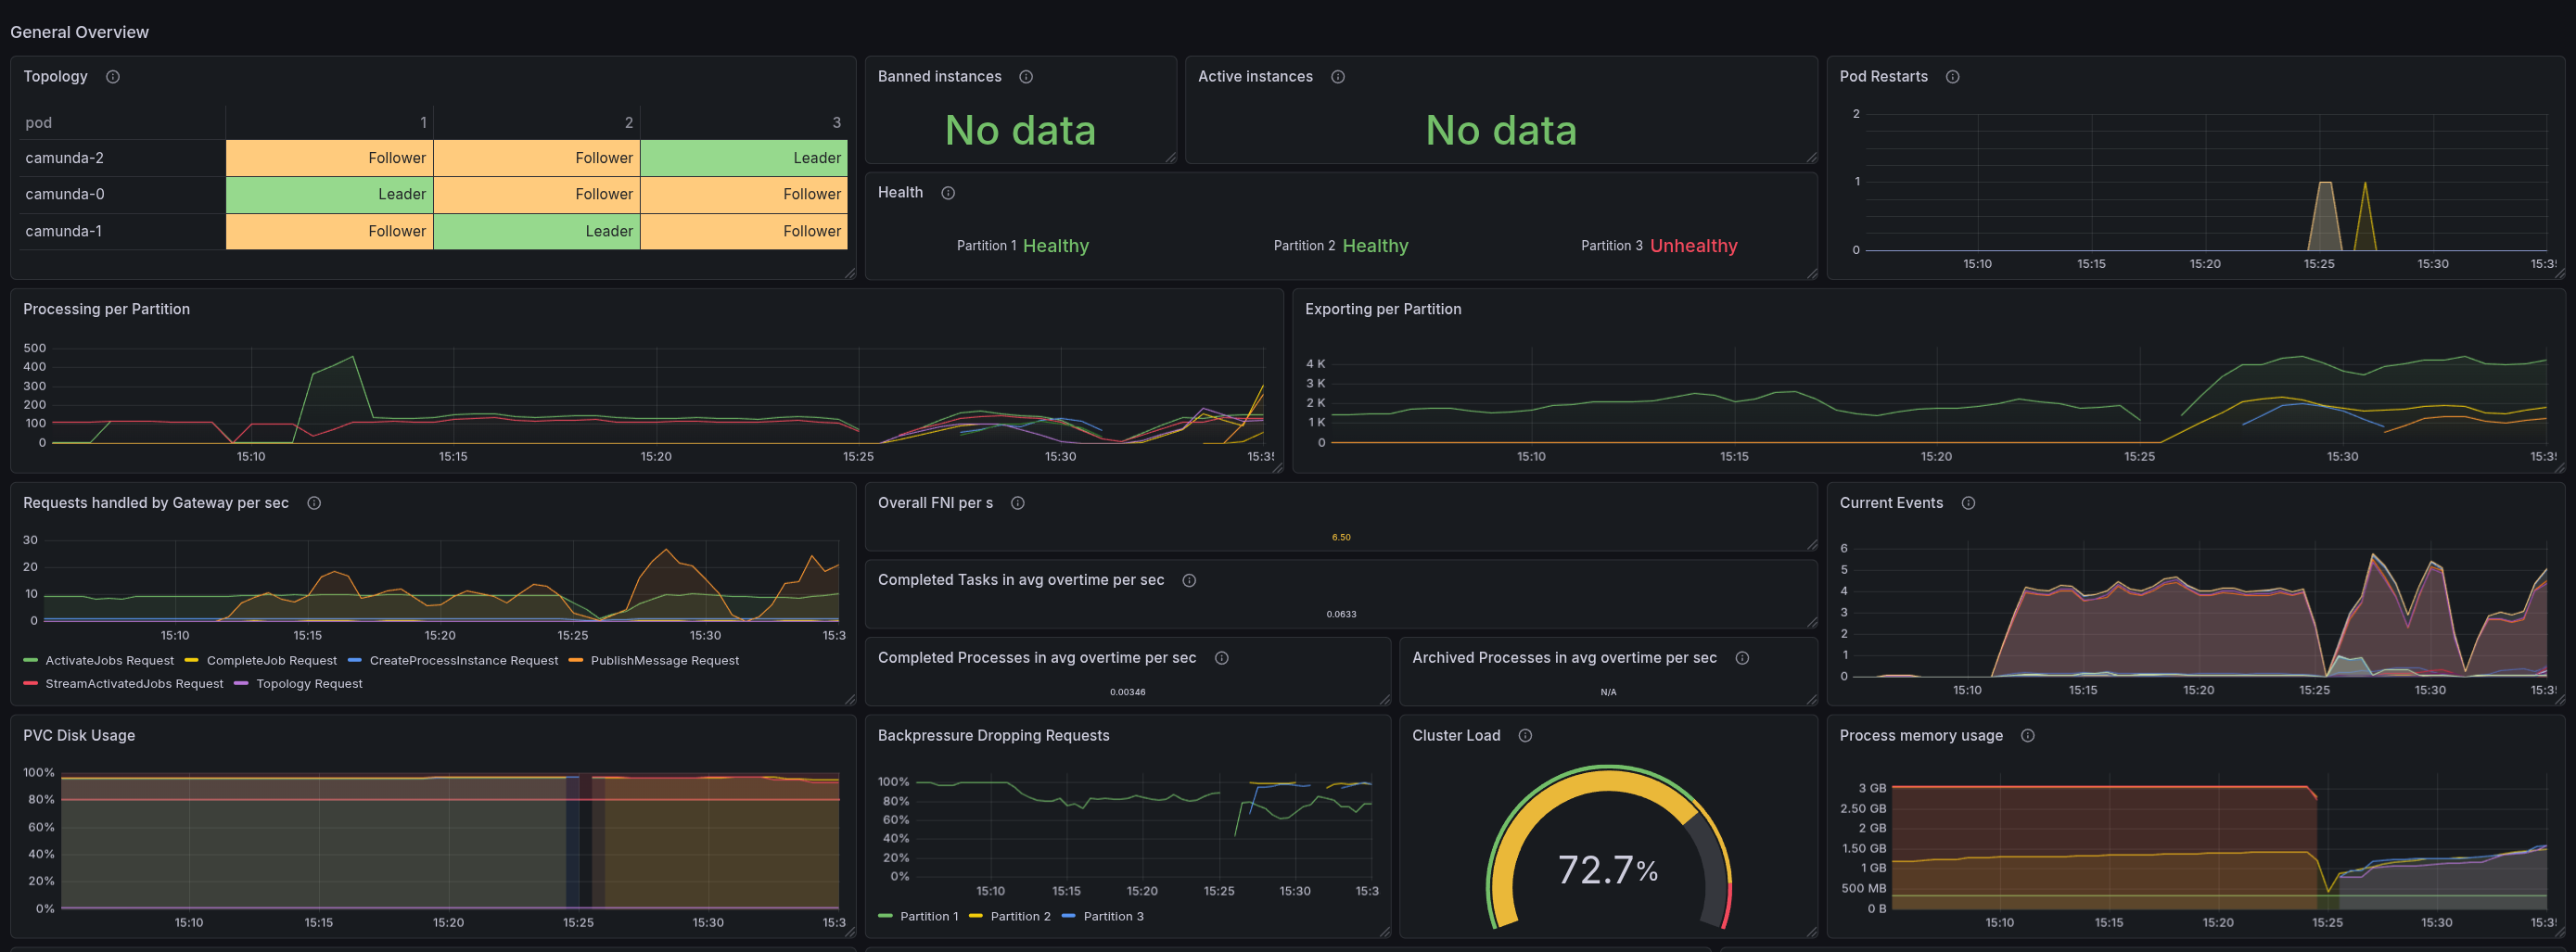
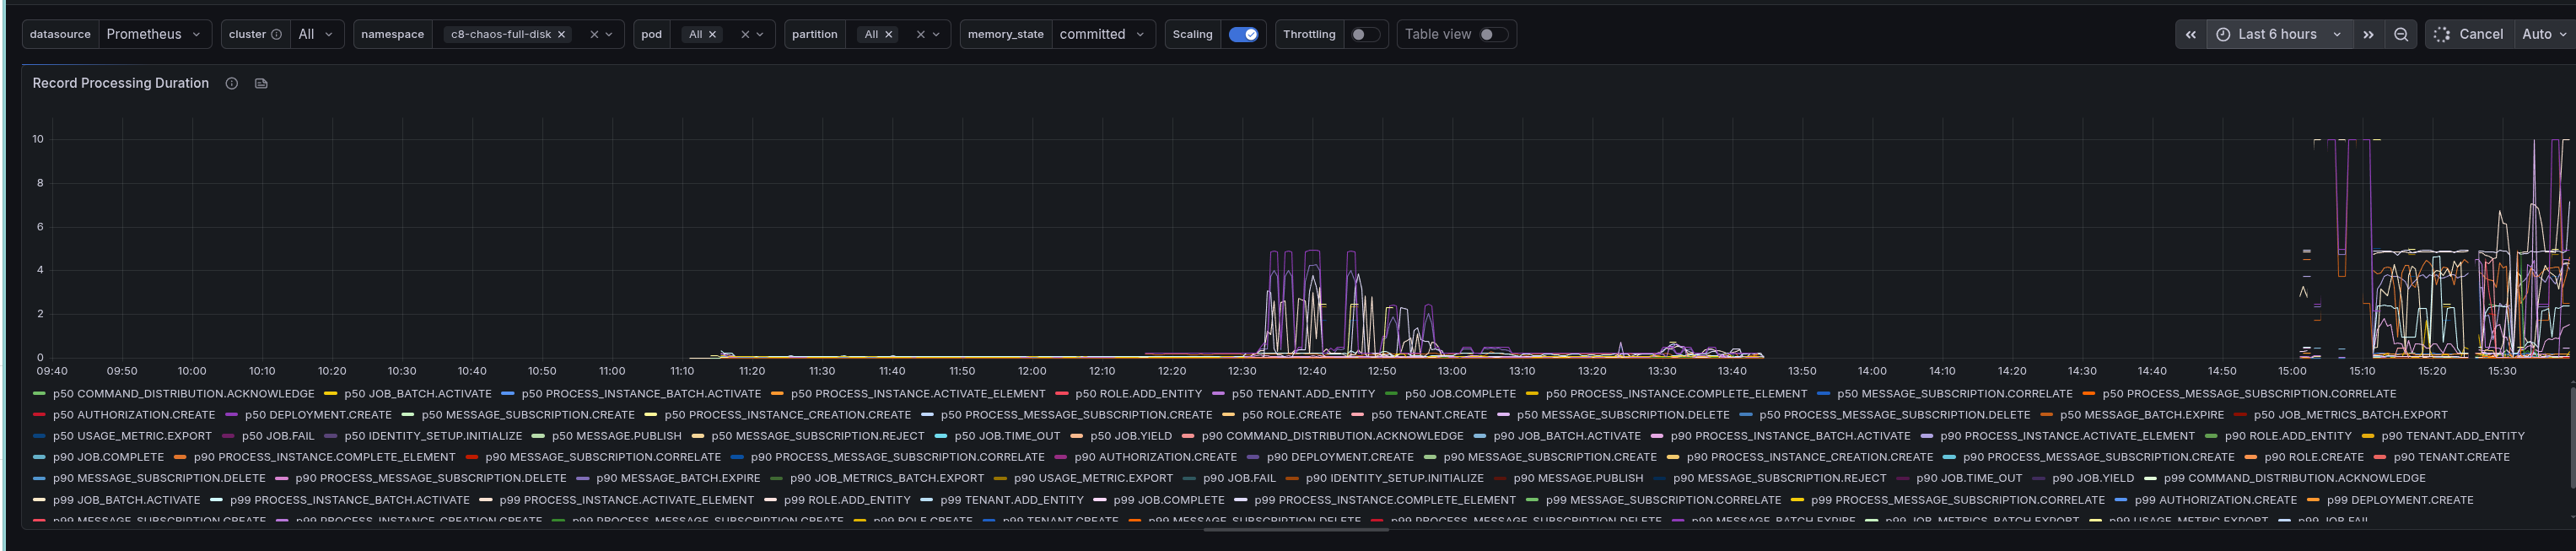
Interesting to note is that some partition got unhealthy after the restart. Based on the log, it seemed that the Engine (StreamProcessor) got blocked while processing records (it ran longer than usual).
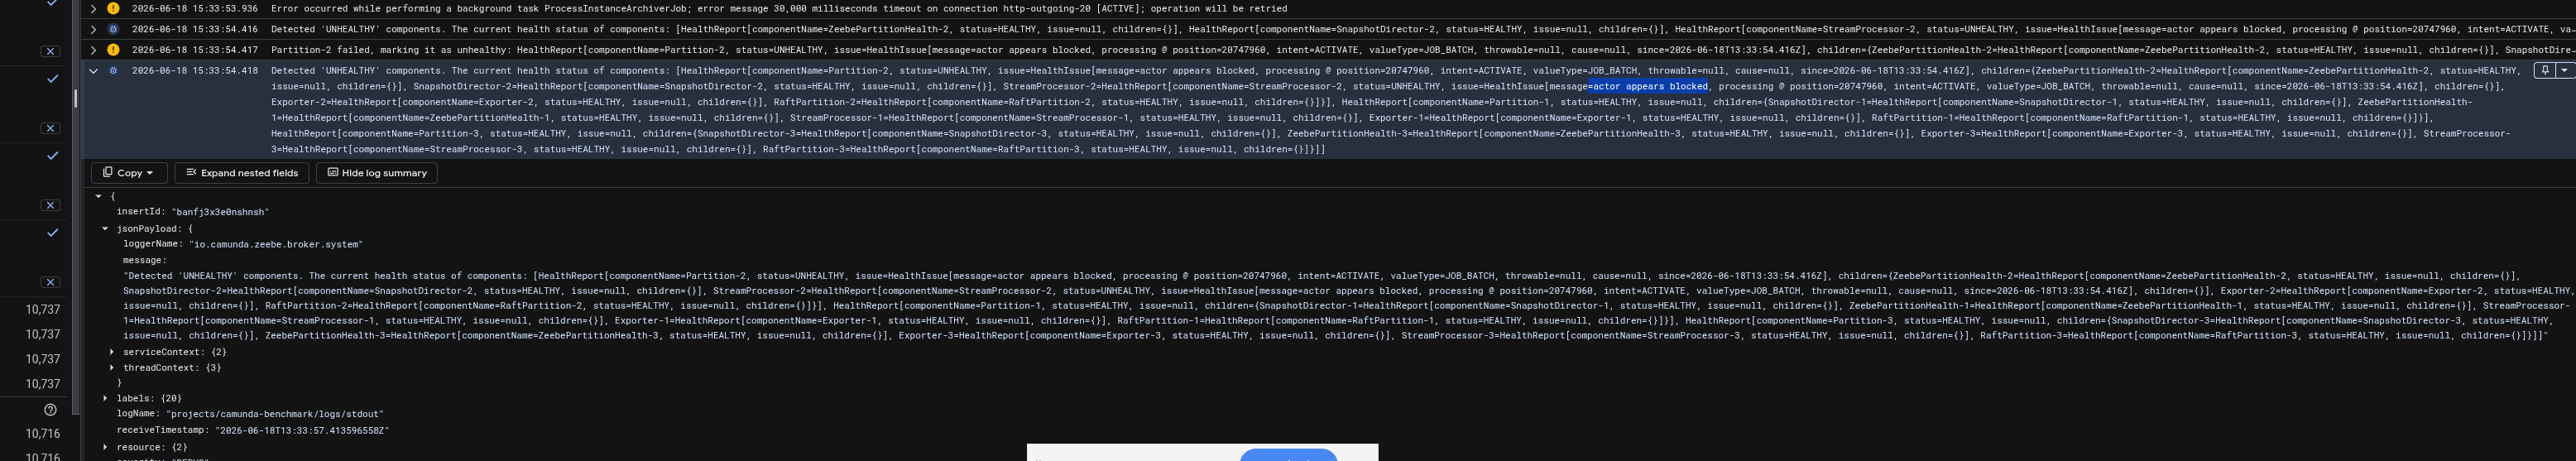
This seems to be because certain records take longer than usual to process. Normally, we are between 50 and 250 ms to process a record, but after restarting and unpausing, some records take 5-10s to process.
At the end, we were able to reclaim the disk space, but it took around the same time as the time we kept the exporters soft-paused.
Key learnings
- Learning 1: When exporters are soft-paused and we restart a node, the exporters need to re-export all unacknowledged records. Ideally, resume them without restarting to avoid this.
- Learning 2: Do not keep exporters soft-paused for a long time, as it can lead to a large backlog of records in the log.
- Learning 3: When the disk is full, the node becomes unresponsive and rejects requests, but the backpressure metric is 0, which can be misleading. Tracked in camunda/camunda#55510.
- Learning 4: When the disk is full, even REST query requests fail. This affects overall availability — web components like Operate that depend on the REST API become unavailable, even though they don't need to write to disk. Tracked in camunda/camunda#55511.
- Learning 5: Record processing can take much longer than usual when recovering from a full disk with a large export backlog. Tracked in camunda/camunda#55512.