Impact of Elasticsearch restarts on Optimize


In today's Chaos Day, we continued our experiments with Optimize and its behavior with the default configuration, when the underlying Elasticsearch cluster has nodes restarting.
This exercise is the continuation of the recent improvements and clarifications we added to our documentation regarding the configuration, impact and scaling of Camunda clusters running Optimize.
TL;DR;
- The default Camunda configuration does not create replica shards for the
zeebe-record-*indices, making them unavailable during any Elasticsearch node restart. - Due to how Zeebe routes records using partition IDs (low-cardinality values hashed with Murmur3), some shards end up completely empty while others hold all the data.
- When one of the
zeebe-record-*indices becomes unavailable, Optimize's single importer thread stalls all other imports — not just the affected resource type — and takes up to 45 minutes to fully recover.
Chaos Experiment
Before starting our experiment, we were aware of 2 issues that we recently uncovered. Although we agreed that they should be fixed and are not representative of a "production setup" of a Camunda cluster, we still wanted to assess their effect and how fixing them would help Optimize or not.
These 2 known issues are:
- The
zeebe-record_*indices are configured with 3 primary shards but no replicas (#55366) - In addition, the indices are not storing data evenly inside their configured shards (#54601)
It turns out that the 1st issue conflicts with our minimal default recommendation to deploy Elasticsearch as Camunda's secondary storage:
- A 3 nodes Elasticsearch cluster
- 1 or more primary shards per indices
- At least one replica shard per index
Elasticsearch's documentation is relatively clear about what to expect when a shard is temporarily unavailable (for instance, because one of the Elasticsearch nodes has been restarted), we wanted to confirm the effects of missing shards on Optimize.
So for this experiment, we were interested in testing 2 behaviors and verifying how Optimize keeps a steady state when we restart an Elasticsearch node hosting either:
- An empty shard of an index used by Optimize ;
- Or actually used shards.
Additional details on #54601
To understand a bit better why we were interested in testing "the restart of a node with an empty shard", we need to explain a bit more the issue (#54601).
We recently discovered a misconfiguration where some of the shards used to store the Zeebe
records are completely empty: we realized that Zeebe exports its records to
multiple zeebe-record-$resourceType indices and routes them to Elasticsearch
shards using the Zeebe partition ID, which causes some shards to be empty and other shards to be overused.
By default, Zeebe organizes its data into partitions and we usually configure Zeebe with 3 partitions (default value for our Helm Chart, default value provided on Camunda SaaS).
As the number of values for "partition ID" is really low (a handful of values), the probability of routing the same partitions to the same shards or to no shard at all is very high. This can be quickly verified using Murmur3 (this is the algorithm Elasticsearch uses):
>>> import mmh3
>>> number_of_shards = 3
>>> for partition_id in {b"1", b"2", b"3"}:
...     hash = mmh3.hash(partition_id)
...     shard_number = hash % number_of_shards
...     print(f"Partition {partition_id} ⇒ shard {shard_number}")

Partition b'1' ⇒ shard 2
Partition b'2' ⇒ shard 0
Partition b'3' ⇒ shard 0
For a more realistic test, we can also confirm this directly using the Elasticsearch _search_shards
API:
- We give to the API the number of the index and the routing key (here, the Zeebe partition ID)
- Elasticsearch returns (in particular) the node(s) and shard(s) that will be used by a search query.
For instance, we can ask which shard would be used by partition ID 3 with:
curl "localhost:9200/zeebe-record_process-instance_8.10.0_2026-07-02/_search_shards?routing=3" | jq .shards
This gives:
{
  "nodes": {...},
  "shards": [
    [
      {
        "state": "STARTED",
        "primary": true,
        "node": "oKkfytvPQEKiEQLEqbn76Q",
        "relocating_node": null,
        "shard": 1,
        "index": "zeebe-record_process-instance_8.10.0_2026-07-02",
        "allocation_id": {
          "id": "tmD1vSTuQ-uAwdshonUHnA"
        },
        "relocation_failure_info": {
          "failed_attempts": 0
        }
      }
    ]
  ]
}
With all our partition IDs, we observe a similar type of response as in our example using Python:
$ for partitionID in 1 2 3
do
    shard=$(curl -s "localhost:9200/zeebe-record_process-instance_8.10.0_2026-07-02/_search_shards?routing=$partitionID" | jq '.shards[][].shard')
    echo "Partition ID $partitionID ⇒ shard=$shard"
done
gives:
Partition ID 1 ⇒ shard=2
Partition ID 2 ⇒ shard=1
Partition ID 3 ⇒ shard=1
What does it mean in practice? On zeebe-record-$resourceType indices, shards are unevenly used:
- One shard is never used and will always be empty.
- One shard will store about 1/3 of the documents saved into that index.
- The last shard will store the last 2/3 of the documents.
With that detour concluded, let's check our chaos experiment of the day!
Expected
When one of the nodes of the Elasticsearch cluster restarts, we expect to see a short-duration slowdown of importing while the Elasticsearch cluster readjusts, followed by a short spike when Optimize catches up, and eventually a return to the same steady state as before the restart in a short amount of time (a couple of minutes).
In addition, considering the Elasticsearch routing issue mentioned before, if we restart the node holding the empty shard, we expect the impact on Optimize to be negligible.
Actual
Initial state
First, we confirmed the routing misconfiguration from #54601 and that shard 0 doesn't have any document by checking the Elasticsearch content itself:
- Shard 0 is completely empty (
docs=0) - Shard 1 and 2 contain many documents (and shard 1 is twice the size of shard 2, confirming the routing tests done above)
$ curl -s "localhost:9200/_cat/shards/zeebe-record_process-instance*?v=true"
index                                           shard prirep state     docs   store dataset ip            node
zeebe-record_process-instance_8.10.0_2026-07-02 0     p      STARTED      0    249b    249b 10.152.18.136 elastic-0
zeebe-record_process-instance_8.10.0_2026-07-02 1     p      STARTED 708701 108.4mb 108.4mb 10.152.4.5    elastic-2
zeebe-record_process-instance_8.10.0_2026-07-02 2     p      STARTED 353889  47.1mb  47.1mb 10.152.70.198 elastic-1
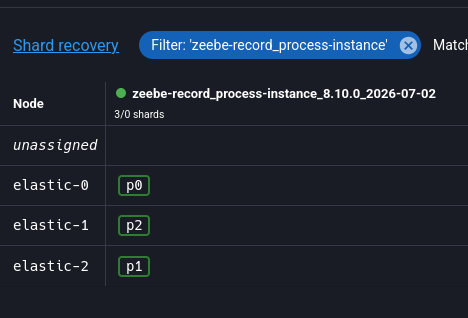
We also confirmed that the index really has no replicas! (with Elasticvue)
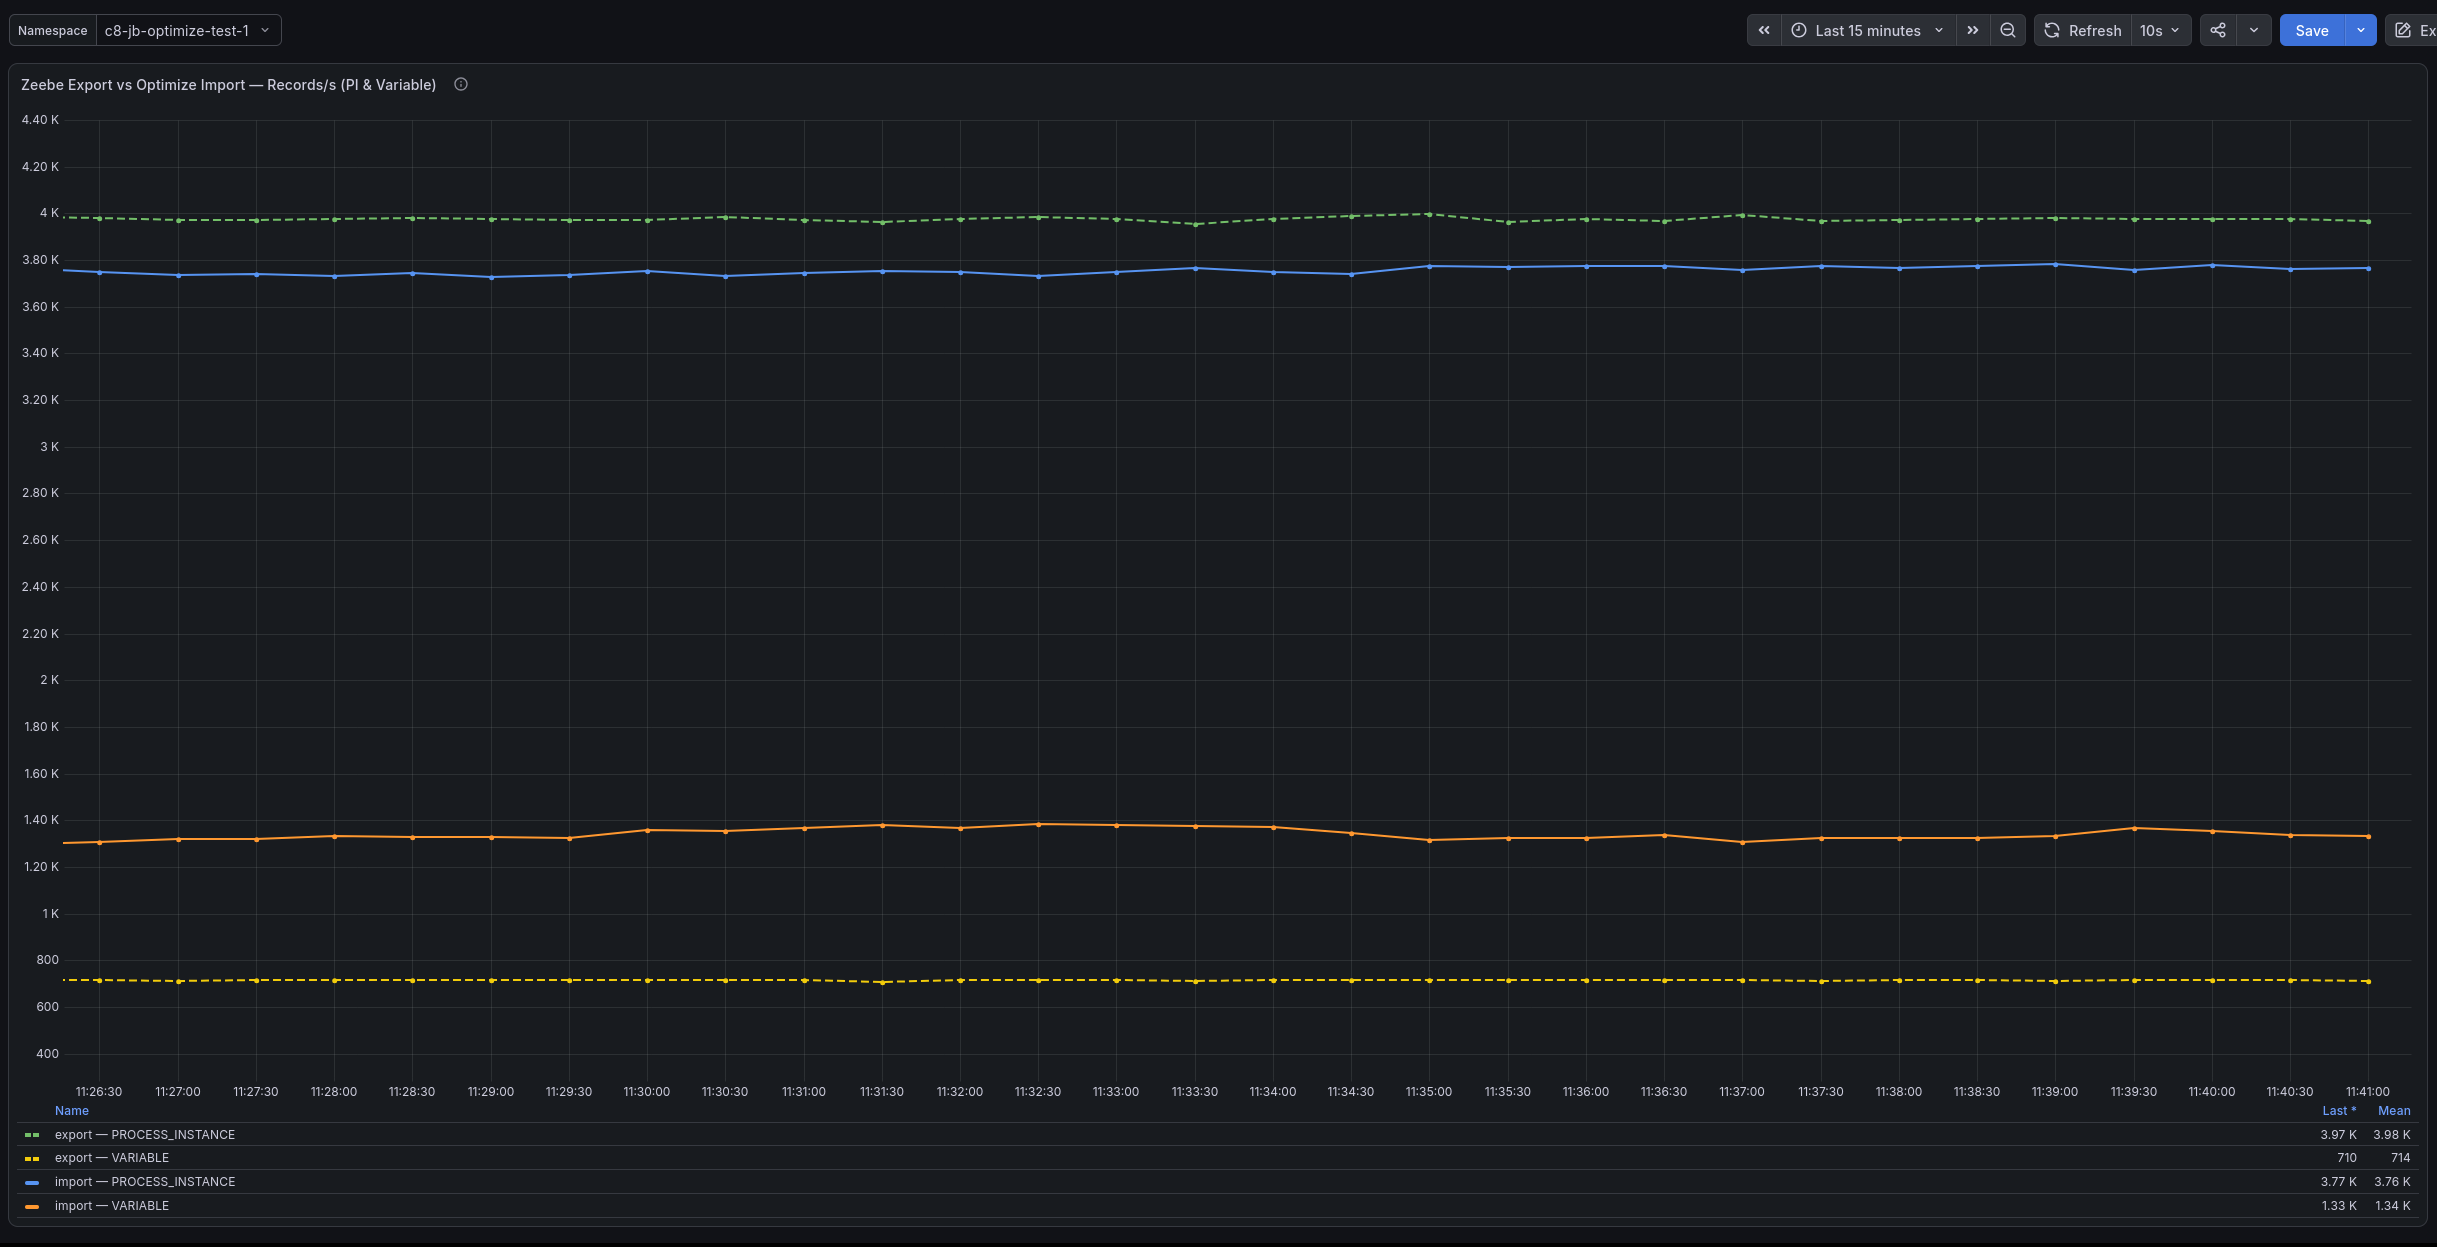
In this initial configuration, without disruption, we have our steady state:
- 🟩 The green line indicates the amount of exported Process Instance by Camunda: ~4000 records/second
- 🟦 The blue line indicates the amount of imported Process Instance by Optimize: a bit less at ~3800 records/second.
The difference between the 2 values is easily explained:
- The exporter measure all the records exporter
- However, Optimize only imports some of them: for instance, it doesn't import the
jobrecords ; this contributes to this slight difference between the 2 totals.
We also verified that all the Optimize indices have replica shards configured (rep=1): we want to make sure here that Optimize itself is correctly configured (something we also fixed recently in our load tests):
$ curl -s "localhost:9200/_cat/indices/optimize*?v=true"
health status index                                            uuid                   pri rep docs.count docs.deleted store.size pri.store.size dataset.size
green  open   optimize-process-instance-bankdisputehandling_v8 NJP28c2VTValgK_Pm0oNLA   3   1    3070686       633049      5.6gb          2.8gb        2.8gb
green  open   optimize-settings_v3                             Sm_dhf78QAy5Aqr4f91cww   1   1          0            0       498b           249b         249b
green  open   optimize-dashboard_v8                            P1z3F5HKSJCoptzv5XiYhg   1   1         10            0       21kb         10.5kb       10.5kb
green  open   optimize-dashboard-share_v4                      xzqcZbQXRye8c6IGH3qR4Q   1   1          0            0       498b           249b         249b
green  open   optimize-single-process-report_v11               jPRlutcNQEeNseET4RAFTQ   1   1          3            0      151kb         75.5kb       75.5kb
green  open   optimize-tenant_v3                               YgxSAjtnR_iV50rMUZ1TlQ   1   1          0            0       498b           249b         249b
green  open   optimize-report-share_v3                         pXydGPf7TBW4b0jzJMMgrA   1   1          0            0       498b           249b         249b
green  open   optimize-process-definition_v6                   nGxETXInRLSbQ7JTgKTR_g   1   1          2            0    424.8kb        212.4kb      212.4kb
green  open   optimize-collection_v5                           vYAuSvGYTD-U8GevLL-KVQ   1   1          0            0       498b           249b         249b
green  open   optimize-decision-definition_v5                  cA-_3YboT3Gb9VJ7heOSog   1   1          0            0       498b           249b         249b
green  open   optimize-timestamp-based-import-index_v5         -qNwD0w0QamUcxBLuWeWGg   1   1          0            0       498b           249b         249b
green  open   optimize-single-decision-report_v10              HRO-TnwjSl6nc-x_YTDtMA   1   1          0            0       498b           249b         249b
green  open   optimize-variable-label_v1                       yBOjeMYhRQOETGsuBlAW3Q   1   1          0            0       498b           249b         249b
green  open   optimize-combined-report_v5                      _AtBcQdeRleBsrKmrbSJGQ   1   1          0            0       498b           249b         249b
green  open   optimize-alert_v4                                qjCe3m6zQzC_fgE4ElQULw   1   1          0            0       498b           249b         249b
green  open   optimize-terminated-user-session_v3              xSzciMRQTZCg8B6-j86vaw   1   1          0            0       498b           249b         249b
green  open   optimize-external-process-variable_v2-000001     K5rkpnBWTG66BMy3IlDWSw   1   1          0            0       498b           249b         249b
green  open   optimize-process-overview_v2                     Khnz7wy-TNyFd0QKvpbw4Q   1   1          2            0      9.7kb          4.8kb        4.8kb
green  open   optimize-metadata_v3                             iAuJil4lRN681wlFZD6g3Q   1   1          1            0      9.5kb          4.7kb        4.7kb
green  open   optimize-instant-dashboard_v1                    dOpIbXIJSc-JGzzmKHh2yQ   1   1          0            0       498b           249b         249b
green  open   optimize-business-key_v2                         EHtHbEFaRDiqmb2R9gSaLw   1   1          0            0       498b           249b         249b
green  open   optimize-position-based-import-index_v3          emgDxywLThOI0R3ZKyJbHw   1   1         15            0    305.3kb        152.6kb      152.6kb
green  open   optimize-process-instance-refundingprocess_v8    HCRGR_aGS_eVLDphlT6mDg   3   1    1779172       196828      2.3gb          1.1gb        1.1gb
Then, we restarted the Elasticsearch node elastic-0 🔥
kubectl delete pod elastic-0
Observations
After the restart, we start to see unexpected behaviors.
First, we quickly see new error logs from Optimize indicating that it started to throttle requests to Elasticsearch:
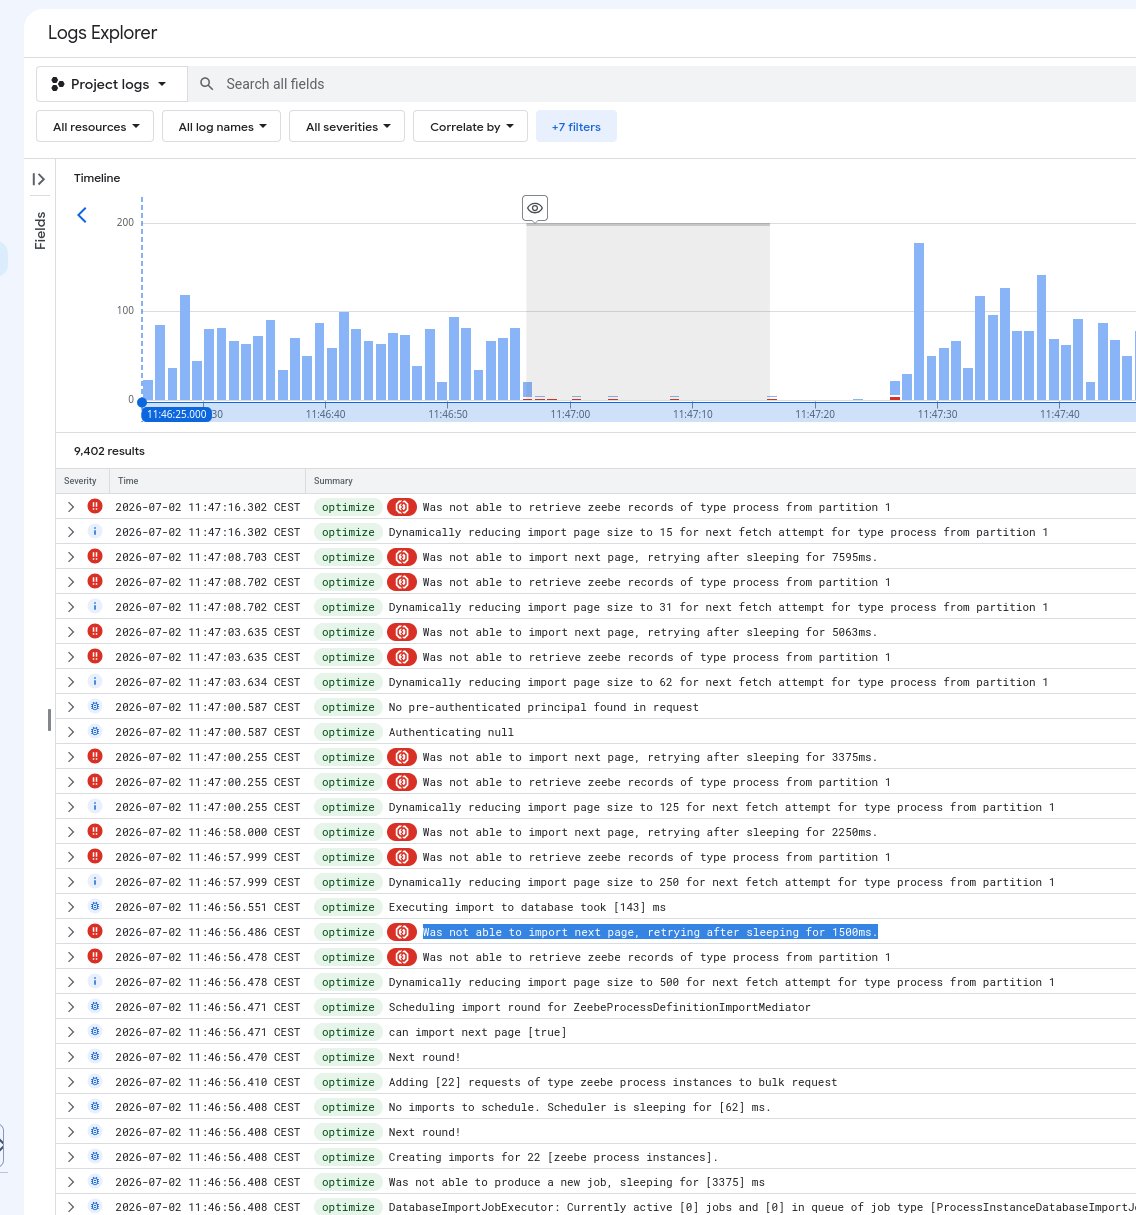
On the one hand, this was unexpected because we purposely restarted the node holding the empty shard!
On the other hand, this is also not unexpected: looking more closely at the logs, they mention the process resource type, not the process instance resource type, which was the only one we
actually cared about before starting the experiment.
We quickly checked how the Zeebe record index was configured for the process resource type:
$ curl -s "localhost:9200/_cat/shards/zeebe-record_process_*?v=true"
index                                  shard prirep state   docs   store dataset ip            node
zeebe-record_process_8.10.0_2026-07-02 0     p      STARTED    6 845.3kb 845.3kb 10.152.18.137 elastic-0
This shows that:
- There's a single primary shard configured for this index
- There are no replica shards configured at all
- The single primary shard is hosted on
elastic-0, which is the node we restarted.
So obviously, when the node is not available, Optimize is not able to read data from the index and it reports the errors we can see in the logs.
However, this index is very small (6 documents!) and there are no error logs for our process instance records, which is what we were expecting! ✅
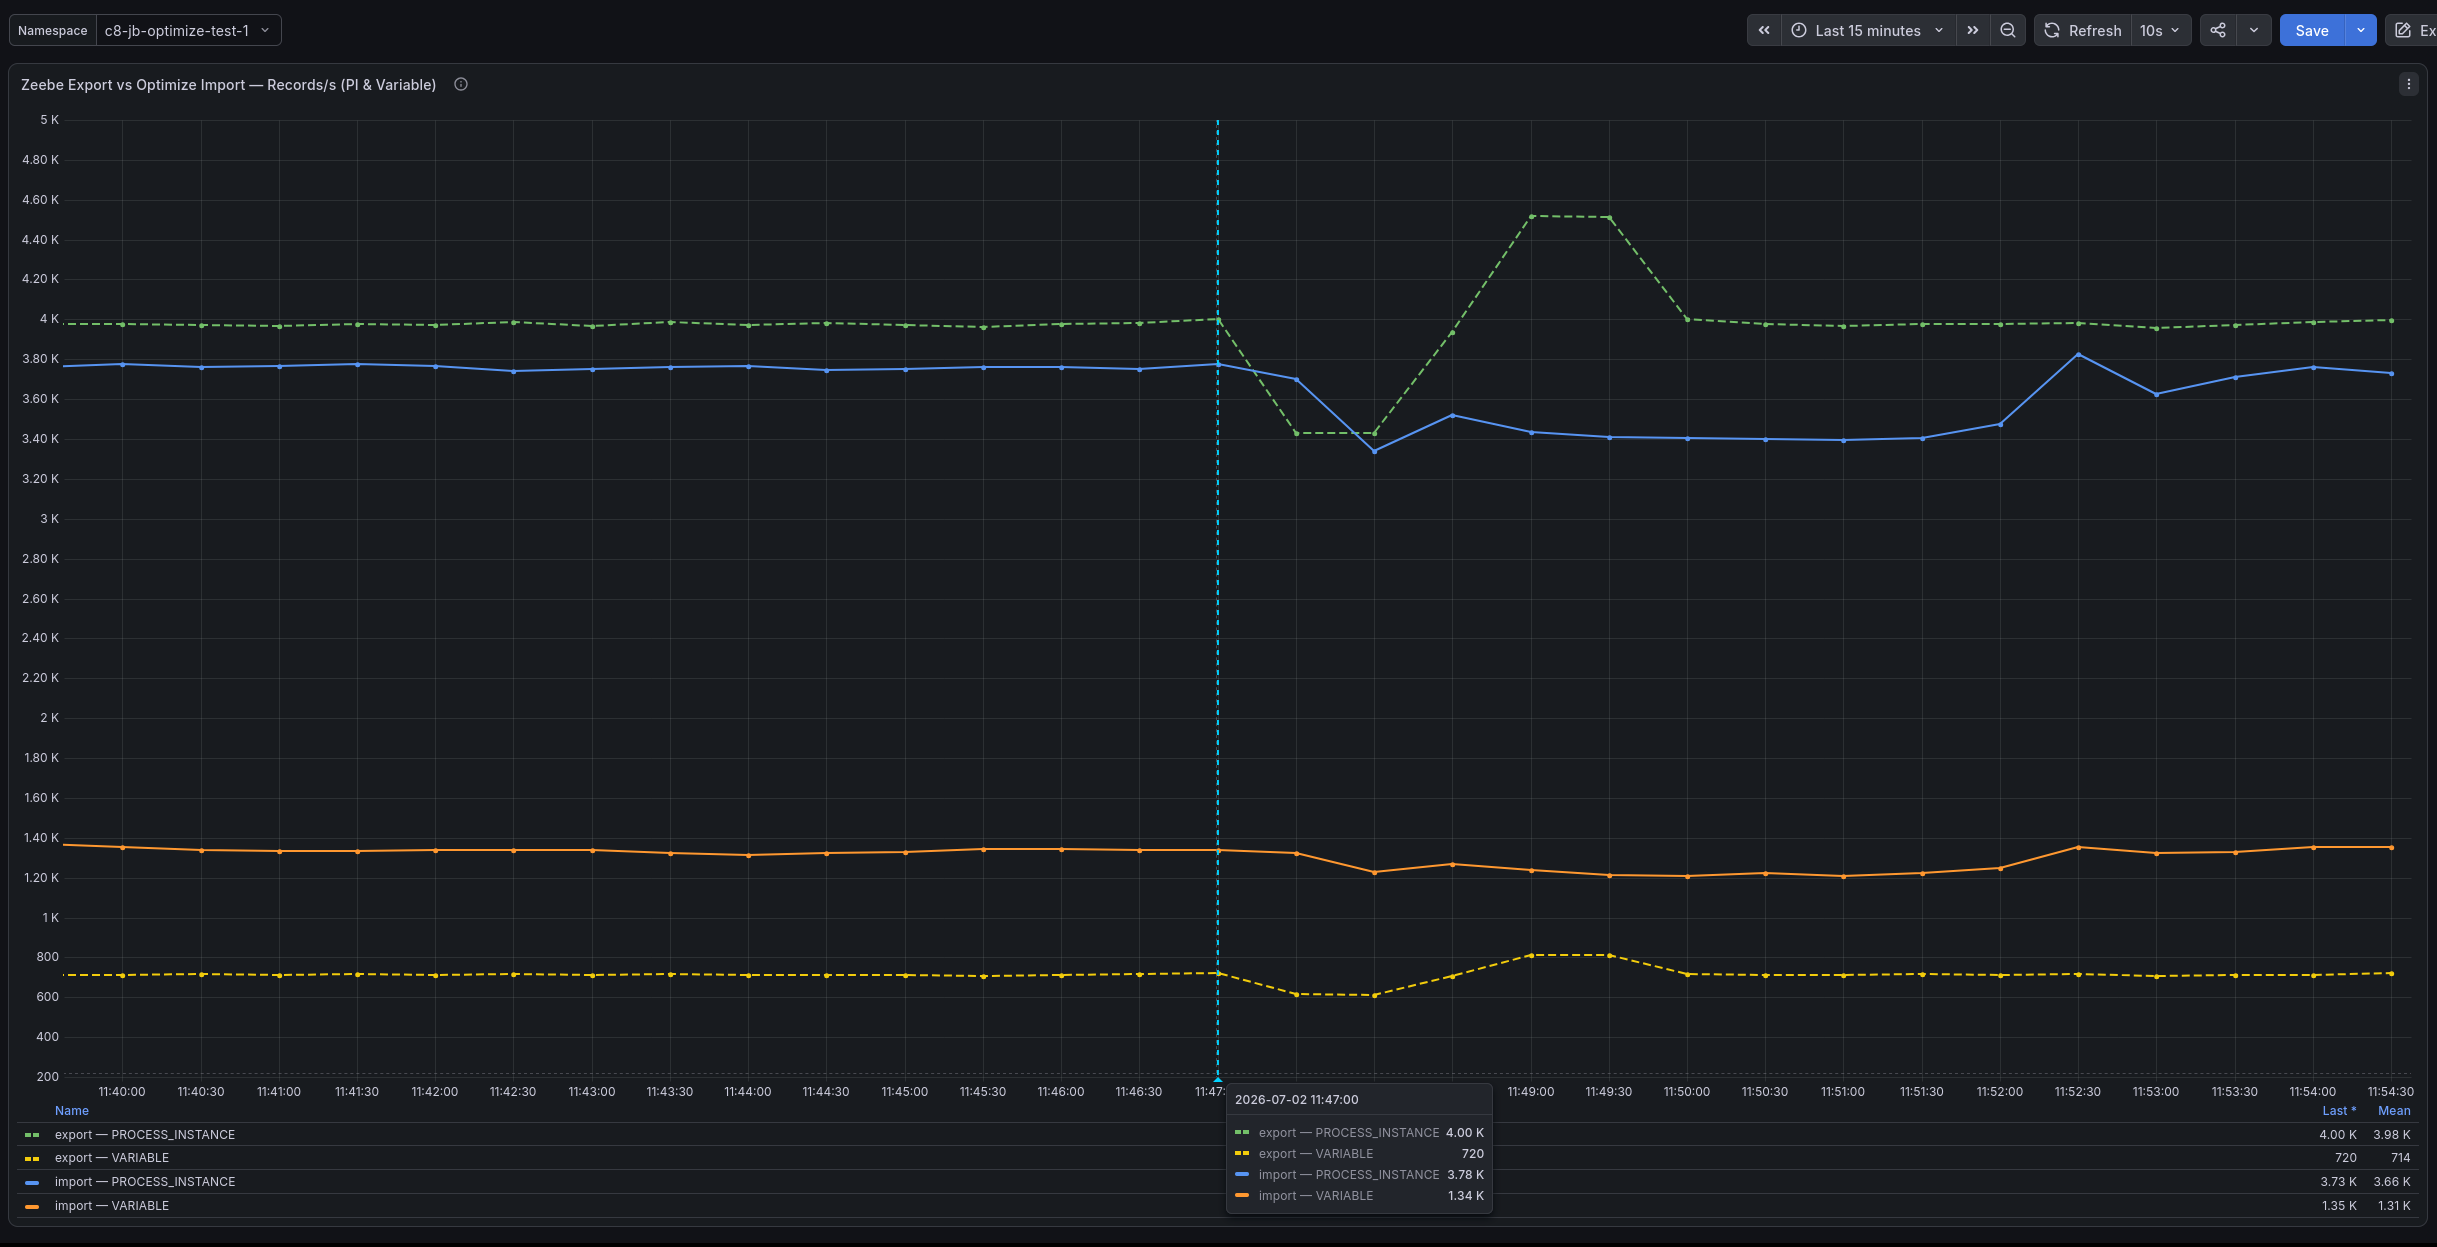
After a few minutes (to allow the system to return to a steady state and for Prometheus to collect the metrics), we looked again at our export/import metrics:
Impact on Camunda exporting
On the Camunda export side (🟩 green line), we start from our previous steady state at about 4000 events/s, then after the restart:
- A short drop to 3400 events/s
- Shortly followed by a spike at 4500 events/s
- Returning back to the 4000 events/s steady state after a few minutes.
This behavior can be explained by the lack of replicas on all the Zeebe records indices:
- For the
zeebe-record-process_instanceindex we looked until now, this should not have any impact, since we are not writing any data into the shard we restarted. - But Camunda exports other data to other indices, that may have different shard allocations.
We looked at the zeebe-record_job index: it suffers from the same routing issue, but the shards were allocated on other nodes:
$ curl -s "localhost:9200/_cat/shards/zeebe-record_job_*?v=true"
index                              shard prirep state     docs   store dataset ip            node
zeebe-record_job_8.10.0_2026-07-02 0     p      STARTED      0    249b    249b 10.152.70.198 elastic-1
zeebe-record_job_8.10.0_2026-07-02 1     p      STARTED 614165 106.7mb 106.7mb 10.152.18.137 elastic-0
zeebe-record_job_8.10.0_2026-07-02 2     p      STARTED 307064  42.8mb  42.8mb 10.152.4.5    elastic-2
Here, we see the same routing issue where shard 0 is not used. However, shard 1 is our 60%-used shard and it was on the node we just restarted. While the node restarted, it prevented Camunda from exporting these records, resulting in the short drop of events. Once the node came back online, Camunda caught up with its backlog, explaining the short spike afterwards.
Impact on Optimize importing
However, on the Optimize import side, we observe a much larger impact than anticipated. If we zoom in only on Optimize imports throughput:
- A longer drop from 3800 events/s to 3300 events/s
- It comes back to 3800 events/s
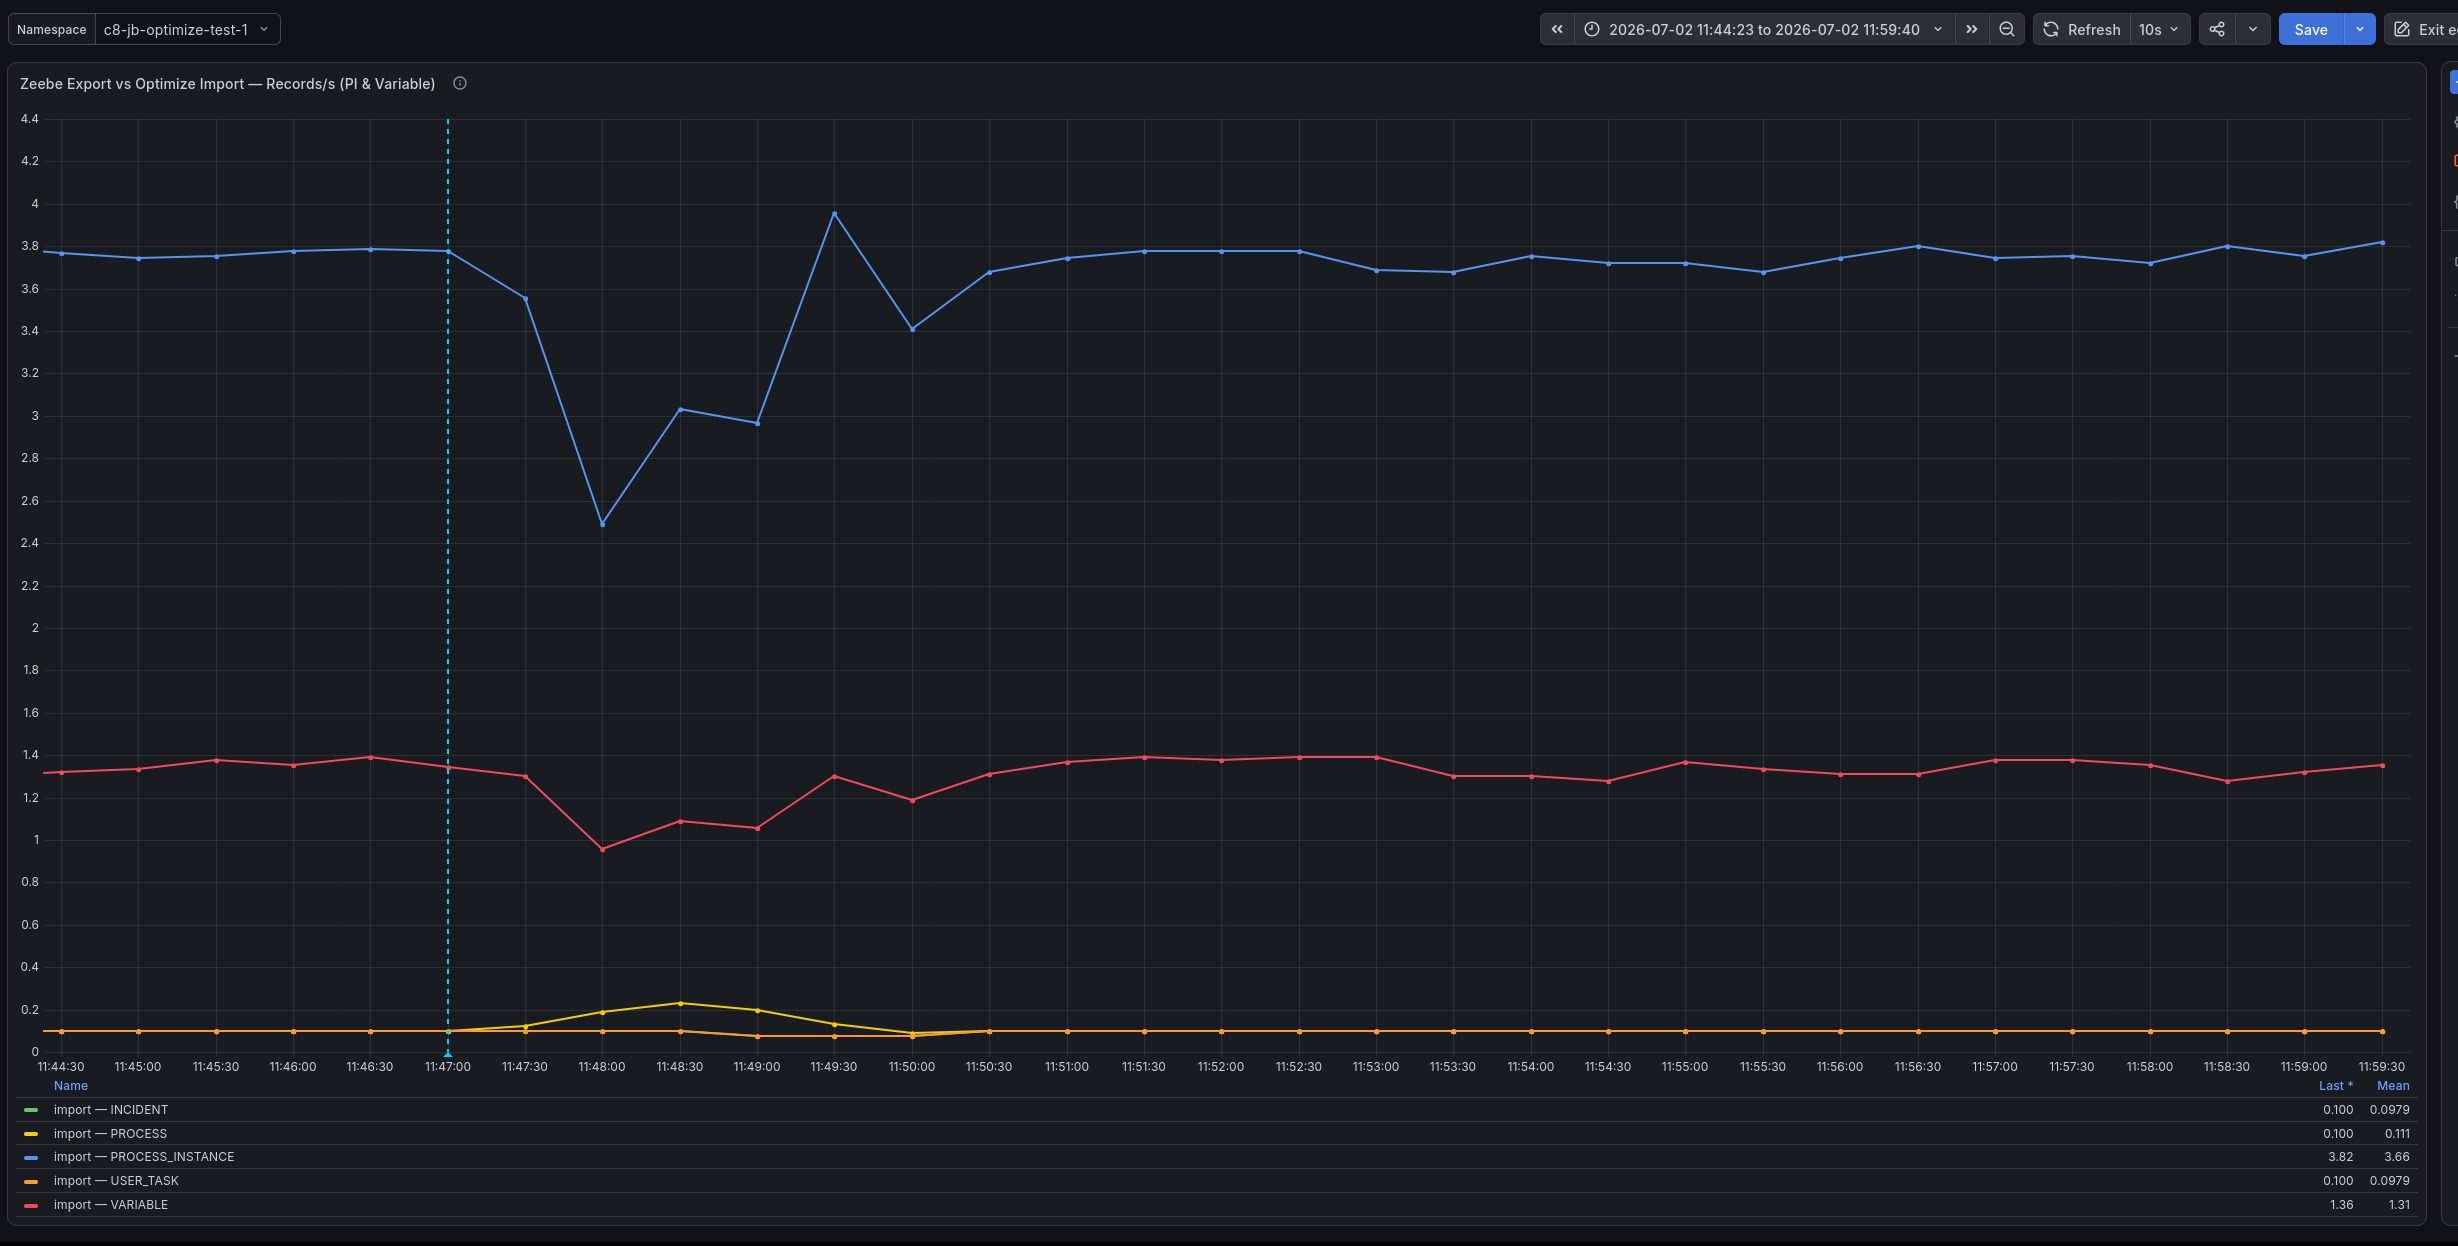
Although the drop is small, we originally anticipated no impact at all since we restarted a shard that is not used by Optimize.
Based on the logs regarding the process resource type, we started to formulate our hypothesis:
- Importing from the
zeebe-record-processindex was not possible because of the missing single shard - Optimize started to backoff importing (just for this index, or generally)
- Did Optimize start to back off all activity with Elasticsearch?
Impact from zeebe-record-process
We quickly found out the issue for this specific index as the logs were very clear.
- At 11:46:56 CEST, we can see the first reaction from Optimize about the node restarting:
In turn caused by:Was not able to import next page, retrying after sleeping for 5063ms.This matches our hypothesis: the single shard is not available, Optimize can't read from the index.org.elasticsearch.client.ResponseException: method [POST], host [http://elastic:9200], URI [/zeebe-record-process/_search?routing=1&typed_keys=true&request_cache=false],status line [HTTP/1.1 503 Service Unavailable]{"error": {"root_cause": [{ "type": "no_shard_available_action_exception", "reason": null }],"type": "search_phase_execution_exception","reason": "all shards failed","phase": "query","grouped": true,"failed_shards": [{"shard": 0,"index": "zeebe-record_process_8.10.0_2026-07-02","node": null,"reason": {"type": "no_shard_available_action_exception", "reason": null}}]},"status": 503}
- After that, Optimize's logs continue to mention the unavailability and that it's throttling the imports for this resource type. All the backoffs accumulate to about 30 seconds:
not able to retrieve zeebe records of type process [...] retrying after sleeping for 10000ms.not able to retrieve zeebe records of type process [...] retrying after sleeping for 7595ms.not able to retrieve zeebe records of type process [...] retrying after sleeping for 5063ms.not able to retrieve zeebe records of type process [...] retrying after sleeping for 3375ms.not able to retrieve zeebe records of type process [...] retrying after sleeping for 2250ms.not able to retrieve zeebe records of type process [...] retrying after sleeping for 1500ms.
What was NOT expected, though, were the debug logs regarding Zeebe process instance: as we mentioned earlier, our assumption was that as the shard on
the node we restarted was completely empty, it should not have any impact on Optimize's process import importer.
However, we can also clearly see the same 30-second gap within the process instance importer:
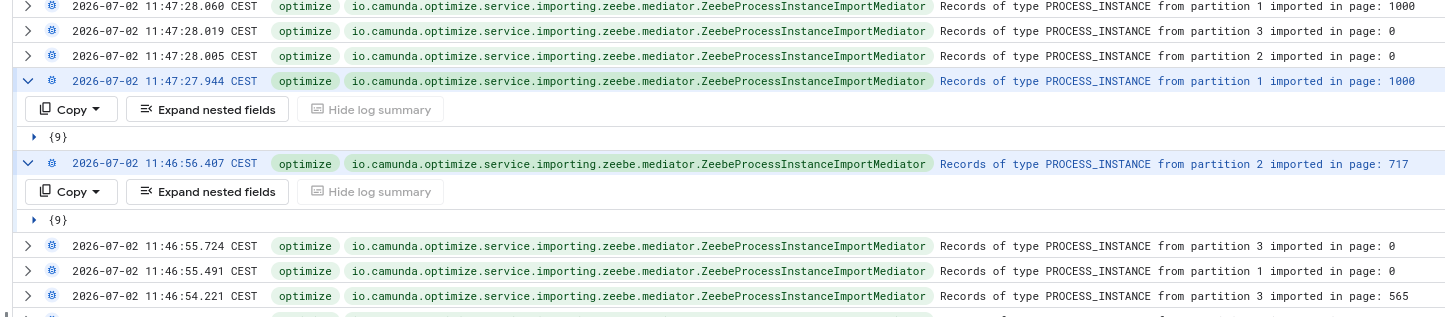
2026-07-02 11:47:27.944 CEST
    io.camunda.optimize.service.importing.zeebe.mediator.ZeebeProcessInstanceImportMediator
        Records of type PROCESS_INSTANCE from partition 1 imported in page: 1000

2026-07-02 11:46:56.407
    CEST io.camunda.optimize.service.importing.zeebe.mediator.ZeebeProcessInstanceImportMediator
        Records of type PROCESS_INSTANCE from partition 2 imported in page: 717
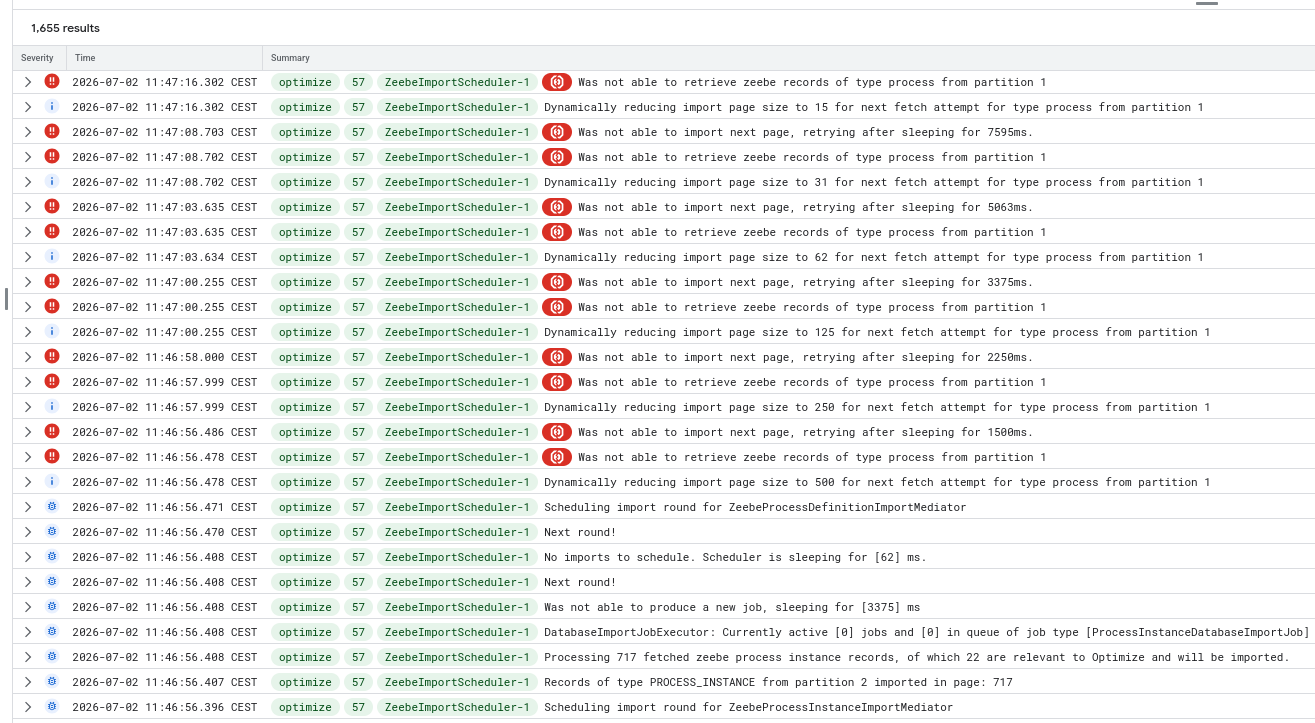
We started to be suspicious about the multi-threading behavior: we were originally assuming that all the importers would be running independently from each other, but having one importer (for process records) having an influence on another importer (for process-instance records) made us think that they were perhaps run only on a single thread.
This was also quickly confirmed: the Optimize logs already report which thread is responsible for the event logs and there is a single thread that
seems to read from all the Zeebe record indices, with threadID=57 and threadName=ZeebeImportScheduler-1:
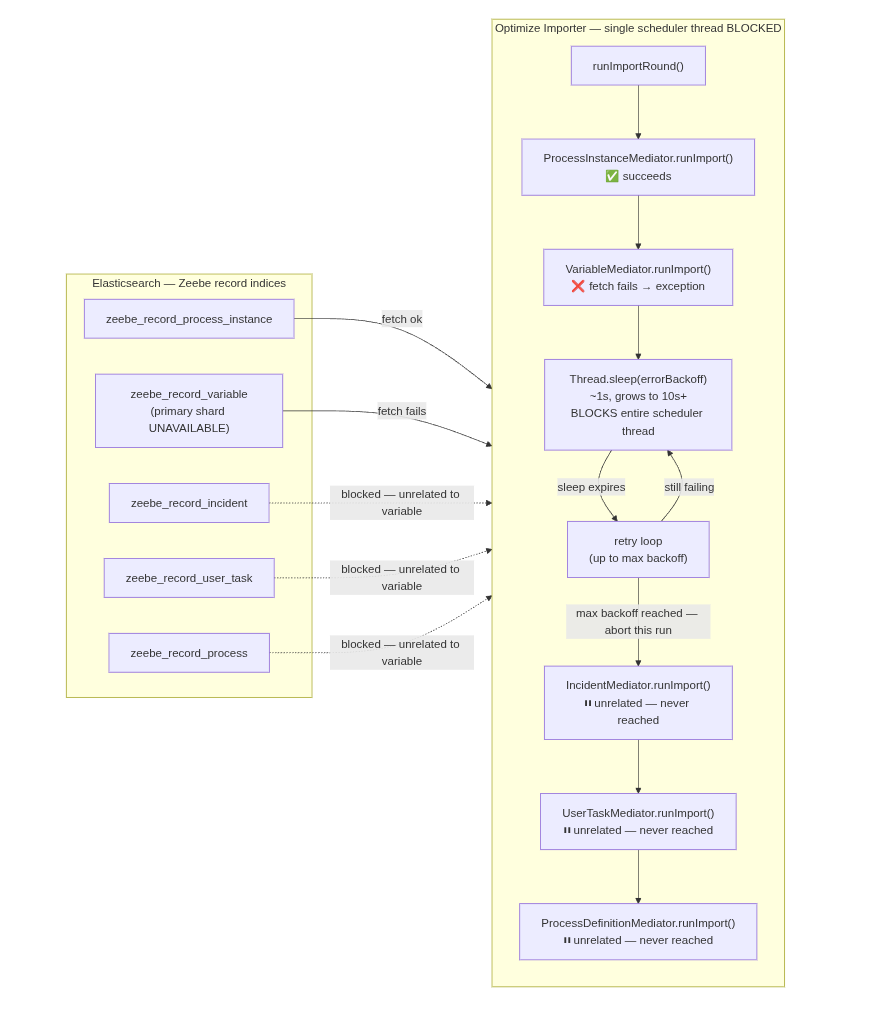
We continued the session by diving into the source code for the Optimize Zeebe records importers. The Optimize importer is divided into "mediators" to read from the indices and then import them into the Optimize indices.
We observed the following two design properties that compound each other:
- All record type mediators (process instance, variable, incident, user task, process definition)
run sequentially on a single shared scheduler thread (
ThreadPoolTaskSchedulerwith pool size = 1 by default) — seeAbstractScheduledService.java#L31-L44andAbstractImportScheduler.java#L74-L119 - The retry loop in
PositionBasedImportMediator.importNextPageWithRetries()callsThread.sleep()directly on that scheduler thread while backing off on errors
The result is that a failure in any one mediator blocks the only available thread, preventing all other mediators from running at all until the error backoff cycle completes. See the drawing below for a visual representation of the problem:
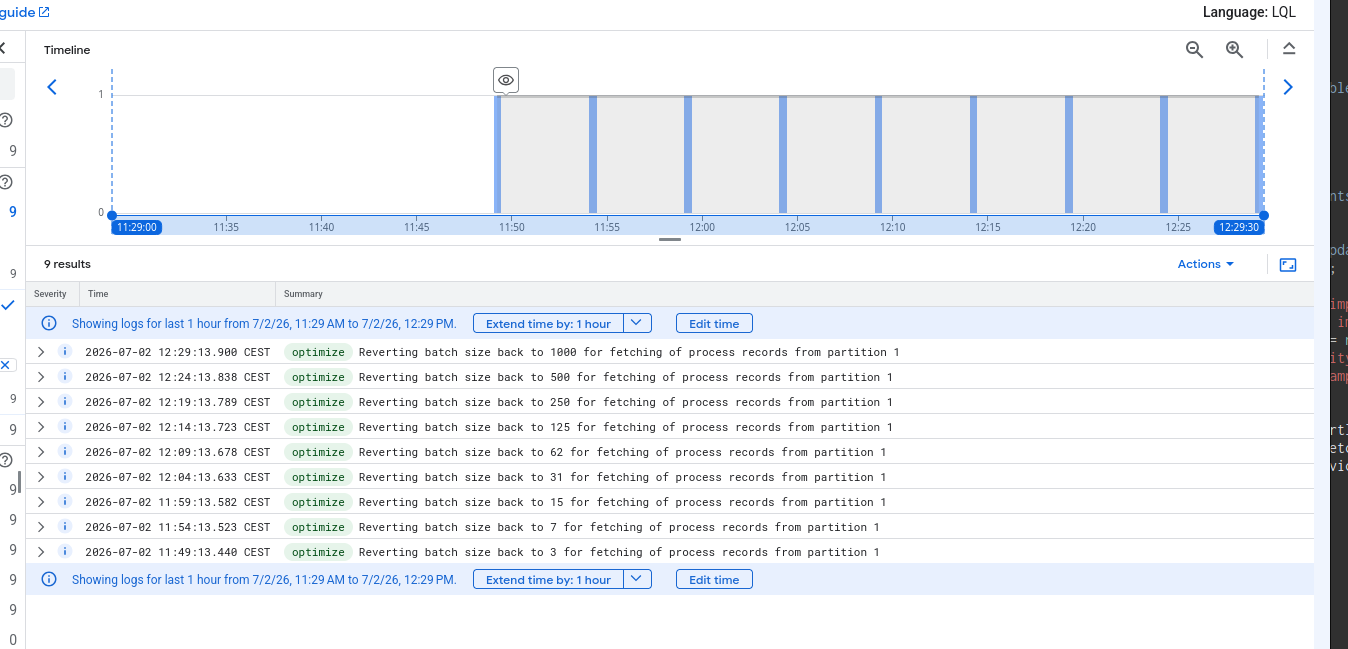
Eventually, Optimize seems to recover completely, but only 45 minutes after the beginning of the incident, by slowly (every 5 minutes) removing the throttling mechanism that was put in place just after Elasticsearch restarted:
Found Bugs
We reported a new issue:
However, this is the accumulation of several factors that led to all the issues found with Optimize:
- No replicas by default for exported Zeebe records indices (#55366)
- Documents not evenly distributed in Zeebe records indices (#54601)
Conclusion
During this experiment, we started with a purposely misconfigured environment from which we wanted to understand the effects a bit better.
We managed to discover how Optimize importers can affect each other, and how busy importers (for "process instances", for which we have thousands of records) can be affected negatively by less busy ones (like "process" which only had 6 events).
We were not able to test the other scenarios we originally planned due to the lack of time:
- How Optimize reacts when the shards holding the large "process instance" records are unavailable?
- How Optimize behavior changes after adding the (recommended for production ;) ) missing Elasticsearch shard replicas?
This may be tested in another chaos day experiment!