OIDC Client issues on cluster bootstrapping


On today's Chaos Day, we investigated how Camunda clients (starters and workers) behave during cluster bootstrap authentication, prompted by camunda/camunda#58983, a report that load-test clients can be unable to authenticate for a long time right after a cluster is created. We wanted to walk through the whole startup sequence, Elasticsearch, Camunda, Management Identity, Keycloak, and clients, and find exactly where a client can get stuck.
TL;DR: During cluster bootstrap, a client can receive an OAuth 401 before Camunda has finished granting the permissions that make its token valid. The Camunda Java client's OAuthCredentialsProvider then latches into a non-retryable cooldown period that defaults to 5 minutes, so that a single early 401 can leave a client unable to authenticate for minutes, even though the rest of the cluster recovers within seconds. Lowering camunda.client.auth.token-fetch-non-retryable-cooldown to 30 seconds fixes this for our load tests (camunda/camunda#62862). Along the way, we also hit a false-positive ERROR log bug (camunda/camunda#62686, fixed) and confirmed two observability gaps: Management Identity exposes no metrics, and the client exposes none for its OAuth token-fetch/retry behavior (camunda/camunda#50684, camunda/camunda#51113).
Chaos Experiment
We ran our usual setup, a full Camunda 8 stack (Camunda, Management Identity, Keycloak, Elasticsearch, Optimize, Connectors) plus our realistic "bank customer complaint/dispute handling" load test (a starter and several job workers).
Our assumption going in was that clients keep a connection open and simply fail to renew it after a failure. To check that, we wanted to correlate three things across the same time window:
- Creation of Keycloak
- Bootstrapping of Management Identity
- Client connection behavior
Expected
This was mostly an investigative exercise. We expected to confirm (or rule out) that clients keep a stale connection open and never renew it after a failure.
Actual

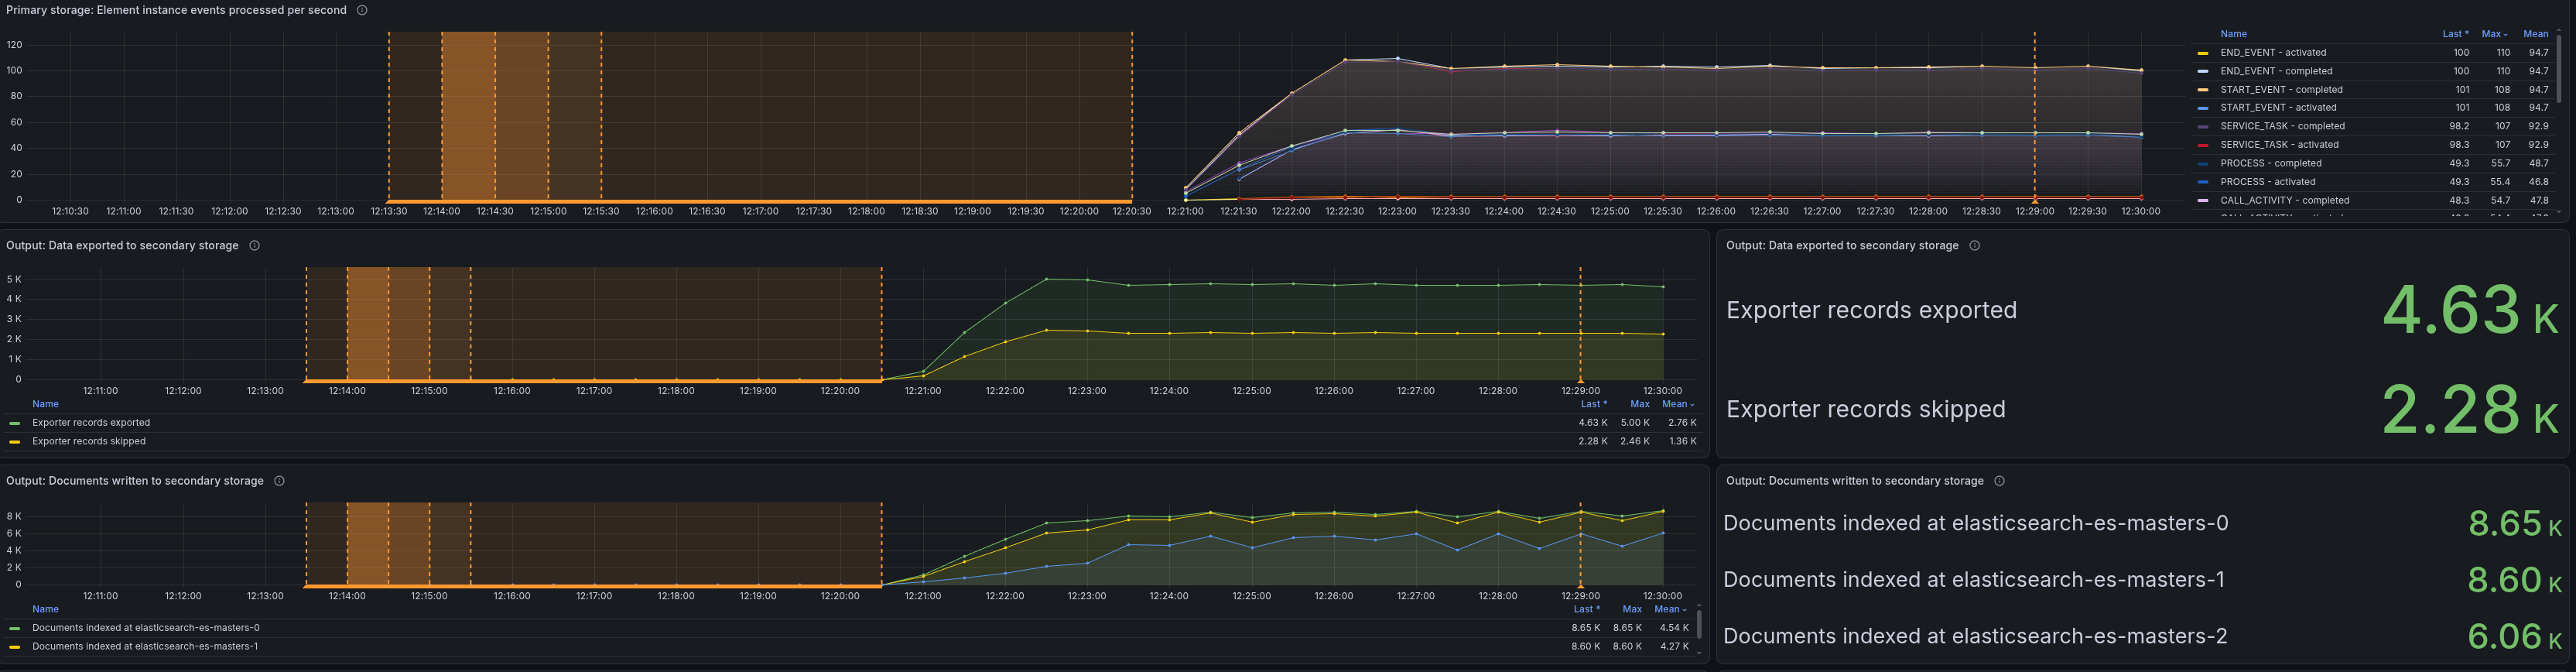
The whole day at a glance: each orange band is one of the four experiments below, where we tore the cluster down (or restarted a dependency) and watched it come back.
First try
We spun up the namespace and watched pods come up. The starter logged repeated Failed to retrieve topology warnings with Connection refused while camunda:8080 was still starting, then connected once it was ready:
"message":"Failed to retrieve topology: ","exception":"io.camunda.client.api.command.ClientException: org.apache.hc.client5.http.HttpHostConnectException: Connect to http://camunda:8080 [camunda/10.152.76.195] failed: Connection refused"
Workers hit the same pattern, retrying the token fetch with backoff:
"message":"Token fetch failed for clientId=orchestration (attempt 1/5), retrying in 577ms: Connection refused"
"message":"Token fetch failed for clientId=orchestration (attempt 4/5), retrying in 6394ms: Connection refused"
That much was expected: Camunda simply wasn't up yet. But the broker itself then logged an unrelated ERROR storm:
"severity":"ERROR","message":"Processor 'io.camunda.zeebe.engine.processing.bpmn.BpmnStreamProcessor' implements SuspensionAware but returned a null suspension behavior for command 'PROCESS_INSTANCE'; processing it normally. Please report this as a bug."
We took the test down at 12:06 to file this as a bug: camunda/camunda#62686 (a false-positive log message, since fixed).
How the bootstrap actually orders itself
Before the second try, we mapped out what actually has to happen, in what order, for Elasticsearch, Keycloak, Management Identity, Camunda, and the clients to all come up together.
Sequential, and each step gates the next:
- Elasticsearch needs to come up and be ready.
- Only then can Camunda come up and create its Elasticsearch schema.
- Camunda's distributed system starts with partitions; every cluster node needs to join before a partition is marked ready.
- A leader is needed for partition one before anything can process on it.
- Only then does Camunda create the init permissions on partition one, via processing and then exporting.
In parallel with all of that:
- Postgres starts.
- Keycloak starts and writes into Postgres.
- Management Identity starts and writes into Keycloak (realms, etc.).
- Clients start and, once Keycloak has enough state, can retrieve a token.
The catch: a token retrieved at that point is not valid yet, because it needs the init permissions from the sequential chain above, which is not done yet either. A client that races ahead of that chain gets a 401, not because anything is actually broken, but because it asked one step too early.
Second try
Pods were running at 12:13:30, but load-test traffic only started around 12:20, a roughly seven-minute gap between "the pods exist" and "the cluster is actually doing work":
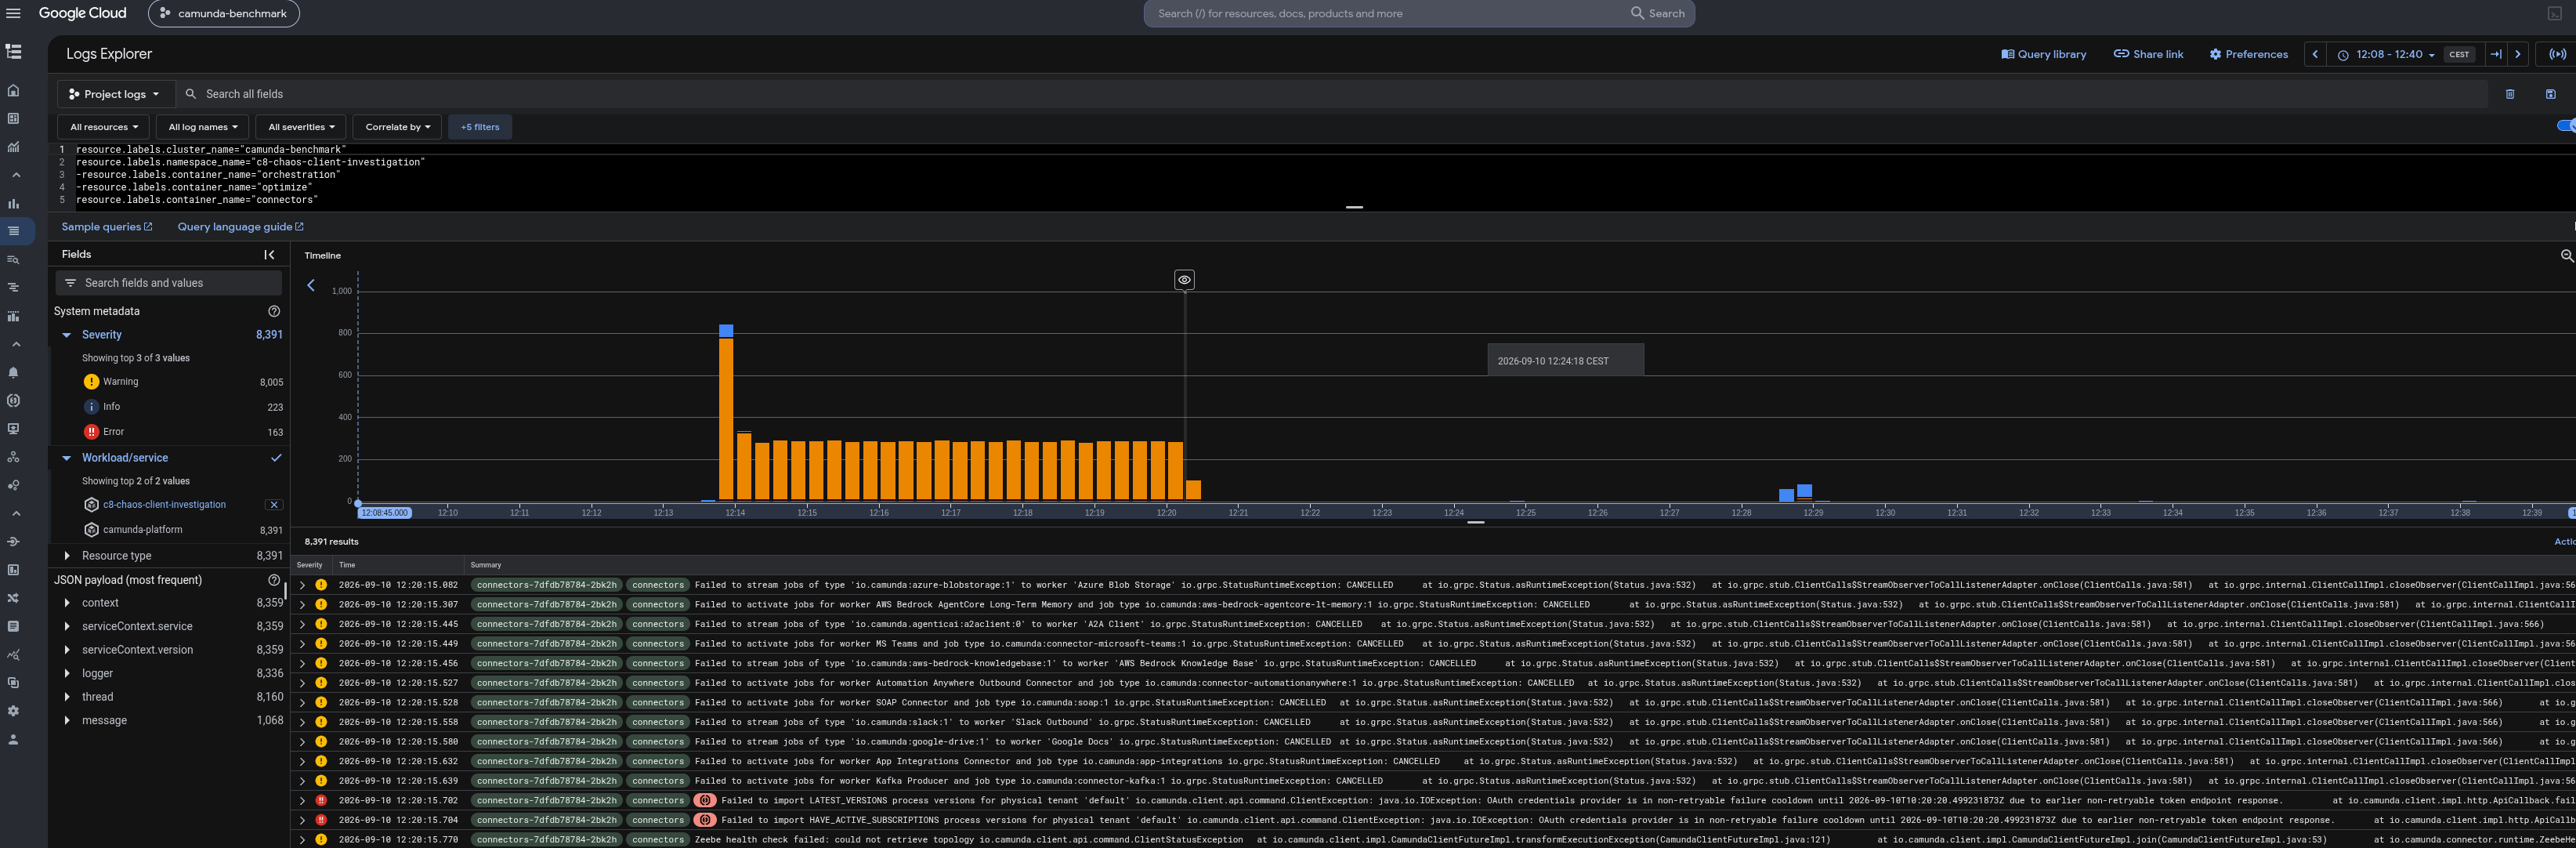
During that window, Connectors and the starter both hit the race described above. Connectors' own readiness probe (/actuator/health/readiness, 30s initial delay, 30s period) meant it kept failing readiness rather than crash-looping:
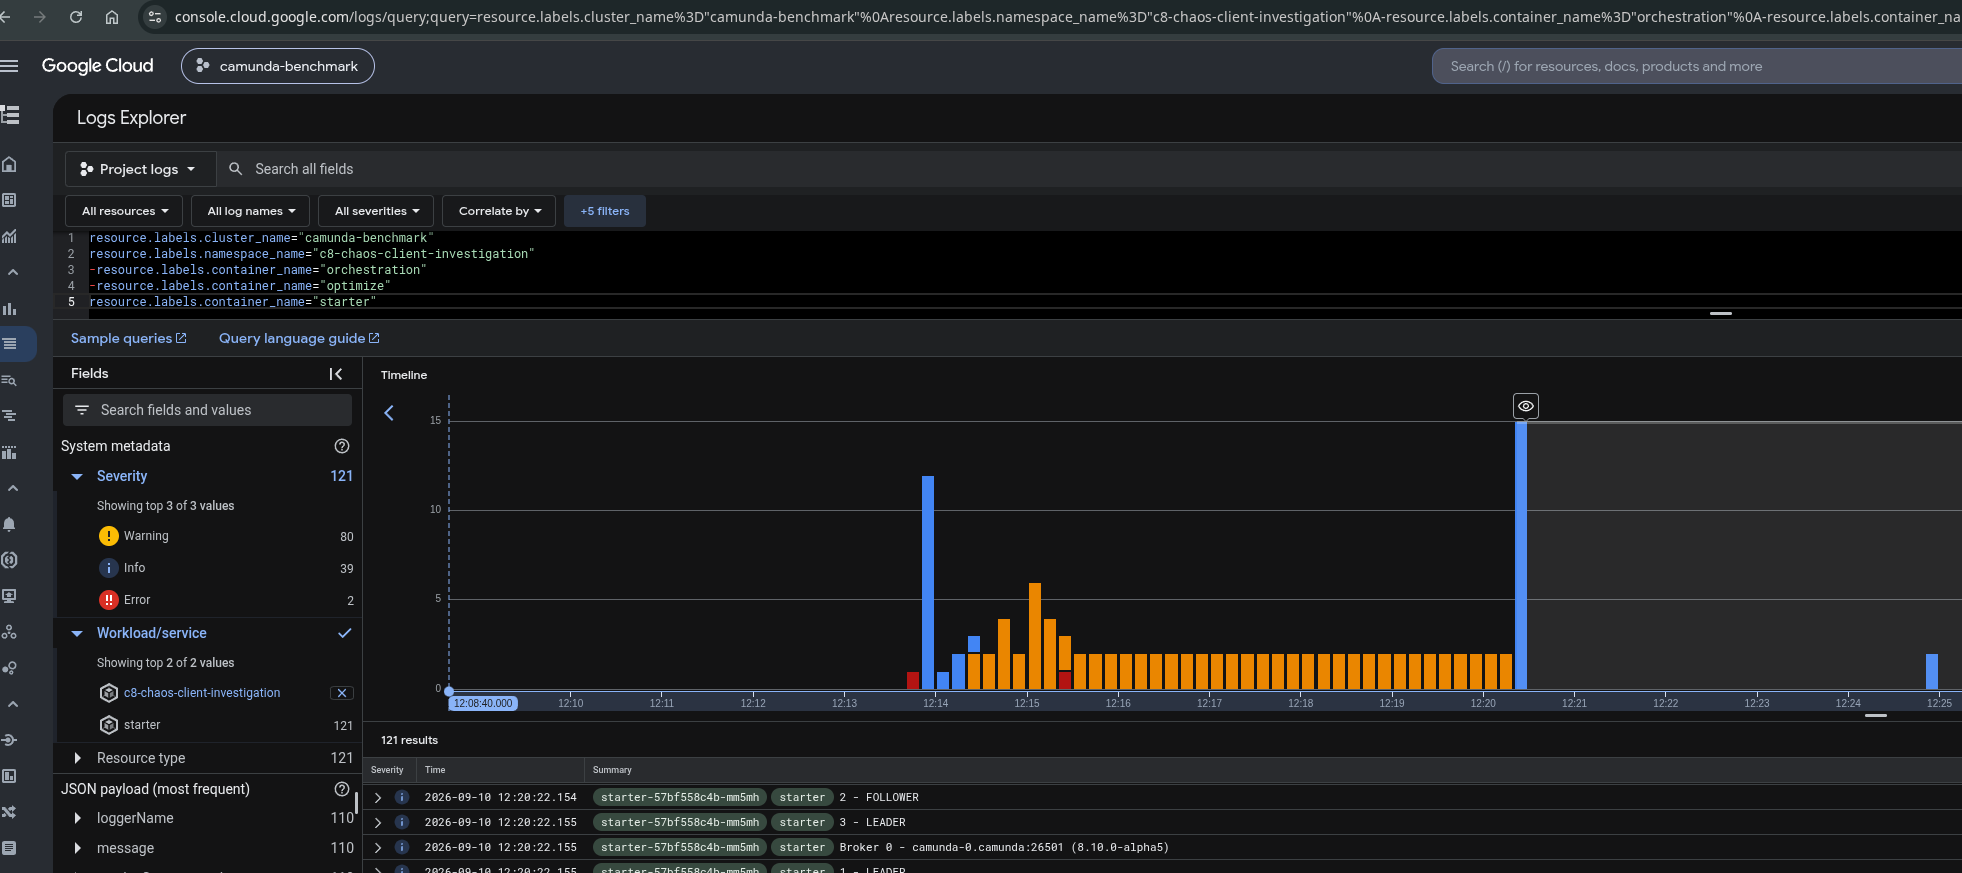
The actual failure, once we found it, was this:
Caused by: java.io.IOException: OAuth credentials provider is in non-retryable failure cooldown until 2026-09-10T10:20:20.499231873Z due to earlier non-retryable token endpoint response.
Caused by: java.io.IOException: Failed while requesting access token with status code 401 and message Unauthorized.
And, more explicitly, from a dedicated log search:
OAuth credentials provider latched a non-retryable failure for clientId=orchestration after an HTTP 401 from the token endpoint .../protocol/openid-connect/token. Token fetches will fail fast until 2026-09-10T10:20:20.724006897Z (PT5M), then a fresh attempt will be made. Verify clientId, clientSecret, audience, and token URL configuration.
In short: the client doesn't retry after a 401, it fails fast for the rest of the cooldown window and only tries again once that expires. The relevant code:
OAuthCredentialsProvider.java#L296and#L388: the latch itself.OAuthCredentialsProviderBuilder.java#L99: the default cooldown, 5 minutes.CamundaClientAuthProperties.java#L157: the Spring Boot starter property backing it, documented here.
Third try, the fix
We recreated the load test with camunda.client.auth.token-fetch-non-retryable-cooldown set to PT30S instead of the 5-minute default:
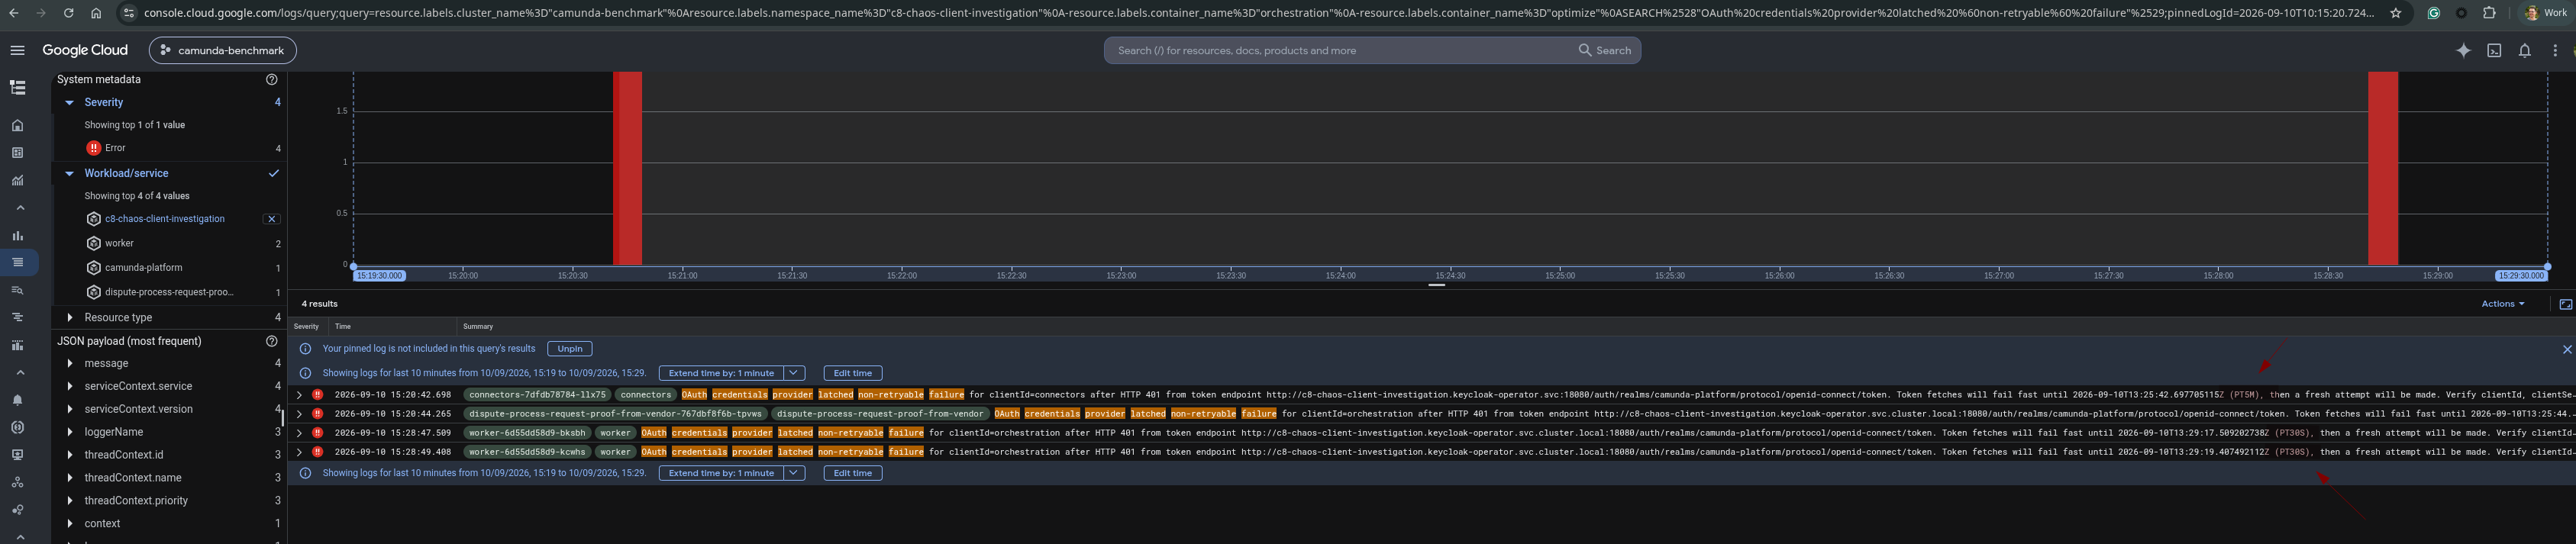
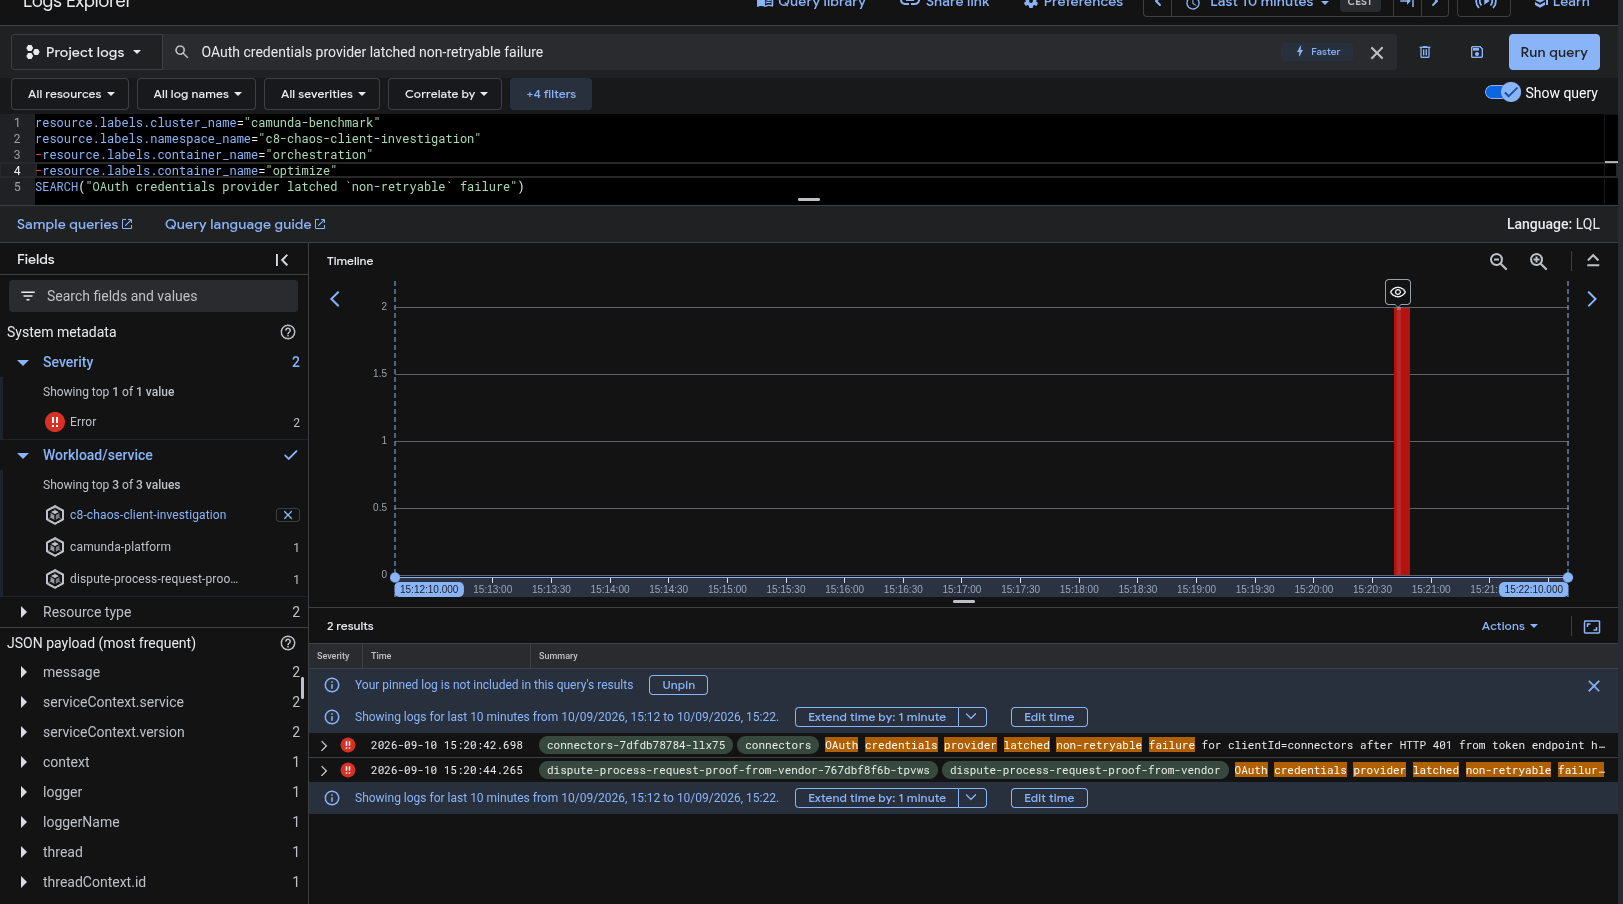
The fix worked. The same latch message now reported the new window:
OAuth credentials provider latched a non-retryable failure for clientId=orchestration after an HTTP 401 from the token endpoint .../protocol/openid-connect/token. Token fetches will fail fast until 2026-09-10T13:29:19.407492112Z (PT30S), then a fresh attempt will be made. Verify clientId, clientSecret, audience, and token URL configuration.
A client that races the bootstrap sequence now waits 30 seconds instead of 5 minutes before its next attempt, which is well within the time the rest of the cluster needs to finish coming up anyway. We applied this to the load-tester defaults in camunda/camunda#62862.
Fourth experiment, Management Identity restarts together with workers
Next, we wanted to understand how the system behaves when Management Identity restarts occur at the same time as worker restarts, as relevant to camunda/camunda#62647. We noticed Management Identity was sharing a node with a worker pod, which may also be the case in that issue.
We couldn't delete the node directly (due to RBAC restrictions), so we repeatedly deleted the Management Identity and worker pods and edited the Keycloak CR directly to force Keycloak to restart. After several rounds of this, we were not able to reproduce the original extended-outage failure mode; everything recovered.
We separately confirm the same underlying symptom occurred the day before, in an unrelated stable-89 load test, as a worker's Spring context failing to start entirely:
Caused by: java.lang.IllegalStateException: Failed to retrieve topology due to authentication error; check your config
Caused by: io.camunda.client.api.command.ClientStatusException: Invalid bearer token
Caused by: io.grpc.StatusRuntimeException: UNAUTHENTICATED: Invalid bearer token
And, later in this same run, a variant where the client couldn't reach the token endpoint at all:
java.net.ConnectException: Connection refused
	at io.camunda.client.impl.oauth.OAuthCredentialsProvider.doFetchCredentials(OAuthCredentialsProvider.java:369)
	at io.camunda.client.impl.oauth.OAuthCredentialsCache.doForceRefreshIfChanged(OAuthCredentialsCache.java:250)
	at io.camunda.client.impl.oauth.OAuthCredentialsProvider.shouldRetryRequest(OAuthCredentialsProvider.java:205)
Both point at the same family of bootstrap-ordering races as the first three tries, just triggered by a mid-life restart instead of initial startup.
Found Bugs and Follow-ups
- Management Identity has no metrics at all. We had no metric to point to for Management Identity's own health, readiness, or token-issuance behavior during this investigation, only log-scraping. Tracked as part of camunda/camunda#51113.
- Clients have no metrics for OAuth refresh, token requests, or failure rate. We only found the non-retryable latch by reading debug logs live during the experiment. Tracked as camunda/camunda#50684.
- False-positive
SuspensionBehaviorERROR log spam, found during the first try: camunda/camunda#62686 (fixed). - The config fix itself: camunda/camunda#62862, lowering the load-test default cooldown to
PT30S. - Tooling gap: to reliably reproduce the fourth experiment, we need a way to deliberately hold a pod down (for example, a blocking
initContainer, or a tool like Chaos Mesh'sPodChaos) rather than repeatedly deleting pods and hoping the timing lines up. Neither ourzbchaosCLI nor the load-testschaos-killerCronJob support this today; worth exploring for future chaos days.